Published: May 31st, 2022
According to the RBA Governor Kent, the Bank is not interested in re-investing money proceeds from maturing bonds. Therefore, the quantitative tightening sentiment from letting bonds roll off would be bullish for the AUD against other currency pairs. Moreover, Kent added that the estimation of the neutral rate is somewhere between 2% to 3%. Regarding economic releases, the latest CAPEX data for Q1 came with a disappointing result at -0.3% q/q after the upward revision in Q4 2021 at 2.3%. The building and structure moved down by 1.7%, while spending on plant and equipment was up by 1.2%.
On the other hand, the SNB gained strength from the past week’s sentiment from Chairman Jordan’s comment on inflation that the bank is not interested in intervening in the currency market. In the latest economic releases, the Q1 GDP came at 0.5%, above the expectation of 0.3%, which increases the intraday selling pressure on the AUDCHF price.
However, further investor sentiment awaits an inflation report that may ease to 0.3% after last month’s 0.4% report. Let’s see the future price direction from the AUDCHF technical analysis.
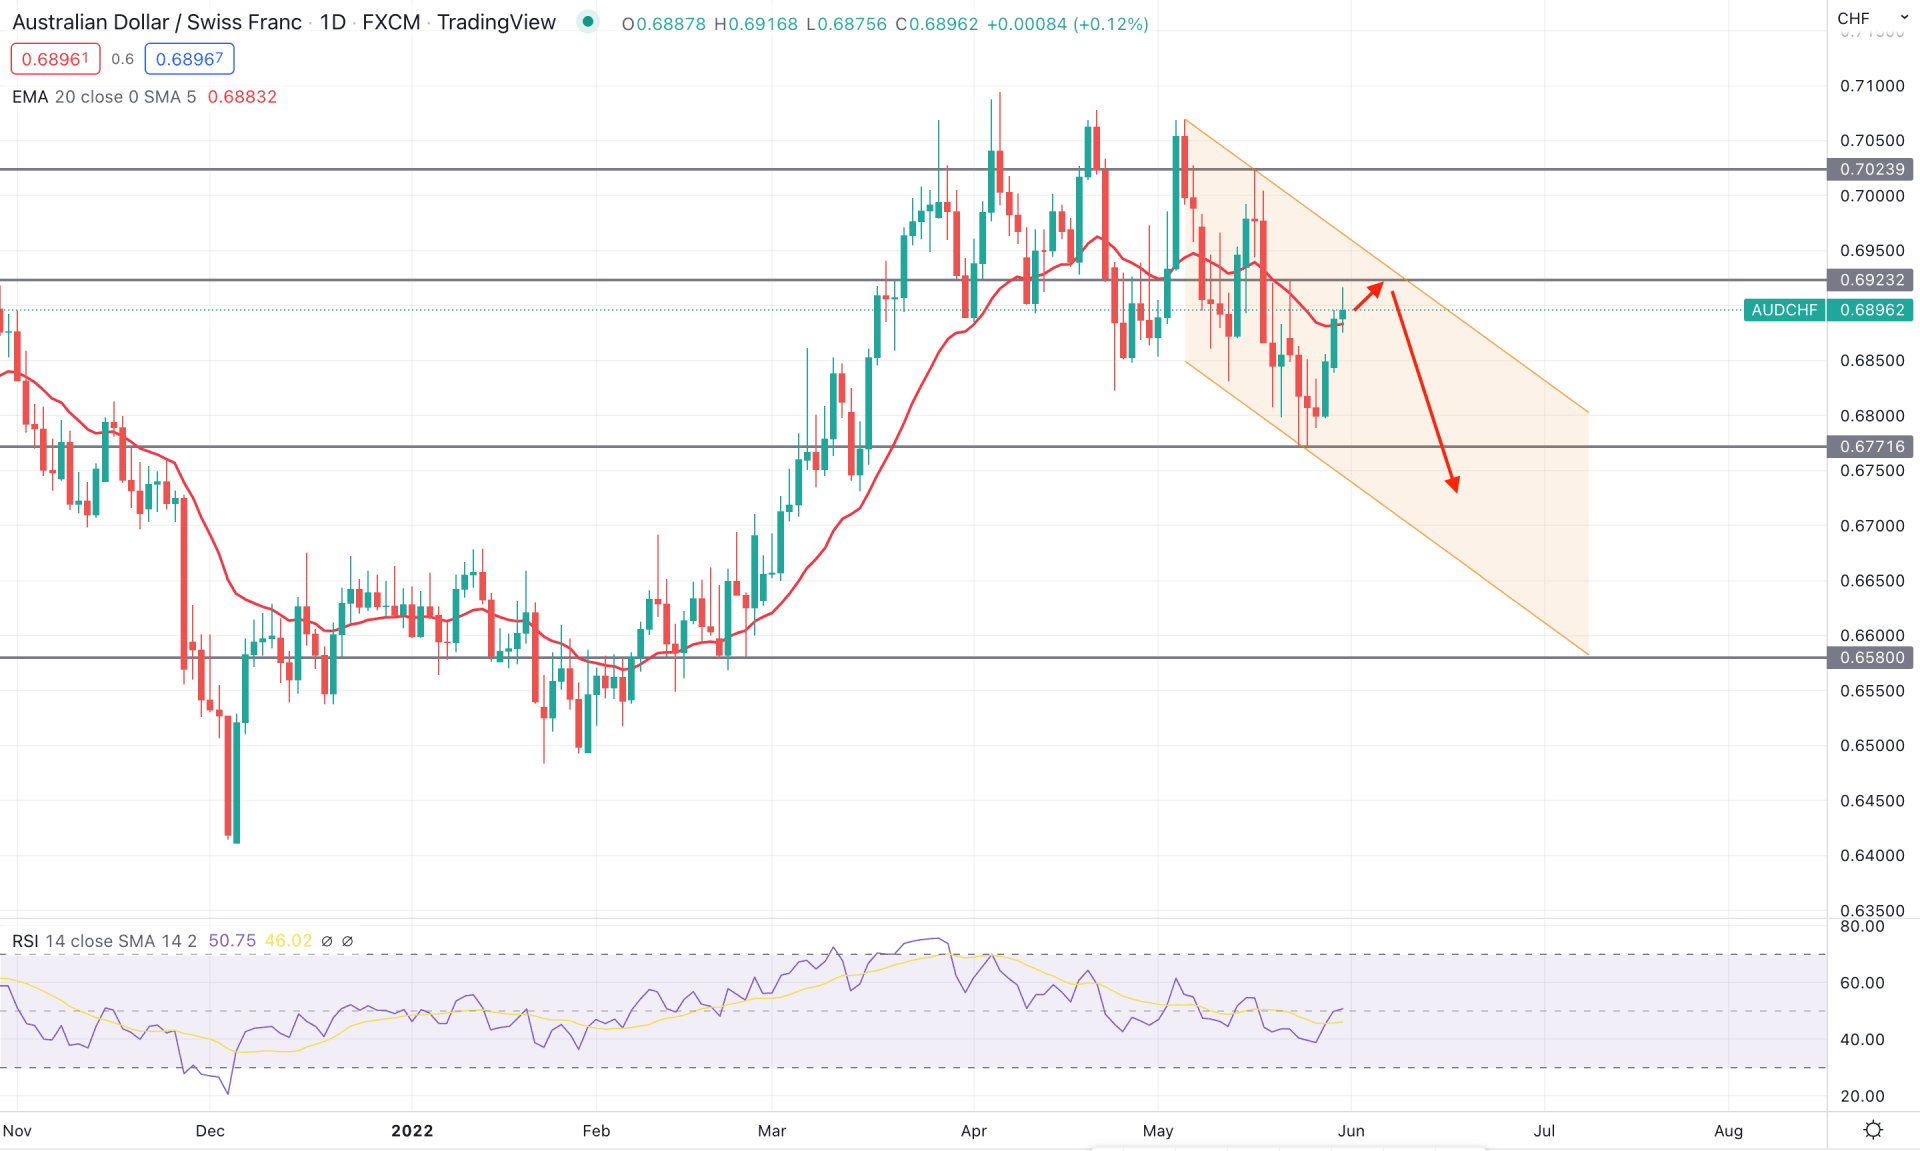
According to the AUDCHF daily chart, the bullish rally started on 31 January swing low topped the 0.7100 key level before going through a massive consolidation. The price remains within a range for more than a month before forming a bearish break of structure at 0.6771 swing low in May. As the current selling pressure is backed by multiple higher lows formation, any selling pressure from the current dynamic level or static 0.6923 level would increase the bearish pressure by extending the channel formation.
The above technical analysis shows how the price trades above the dynamic 20 EMA resistance while the strong daily candle above this level is not seen. On the other hand, the RSI reached the neutral 50 level, where the test of the oversold 30 level is still pending.
Based on the daily context, investors should closely monitor how the price trades at the 0.6870 to 0.6930 area from where any intense selling pressure with a bearish daily candle would lower the price toward the channel support below the 0.6770 area. On the other hand, the price is still trading above the 50% correction of the February-March bullish trend, where a stable bullish price action above the 0.6923 resistance level would be a trend-changing event.
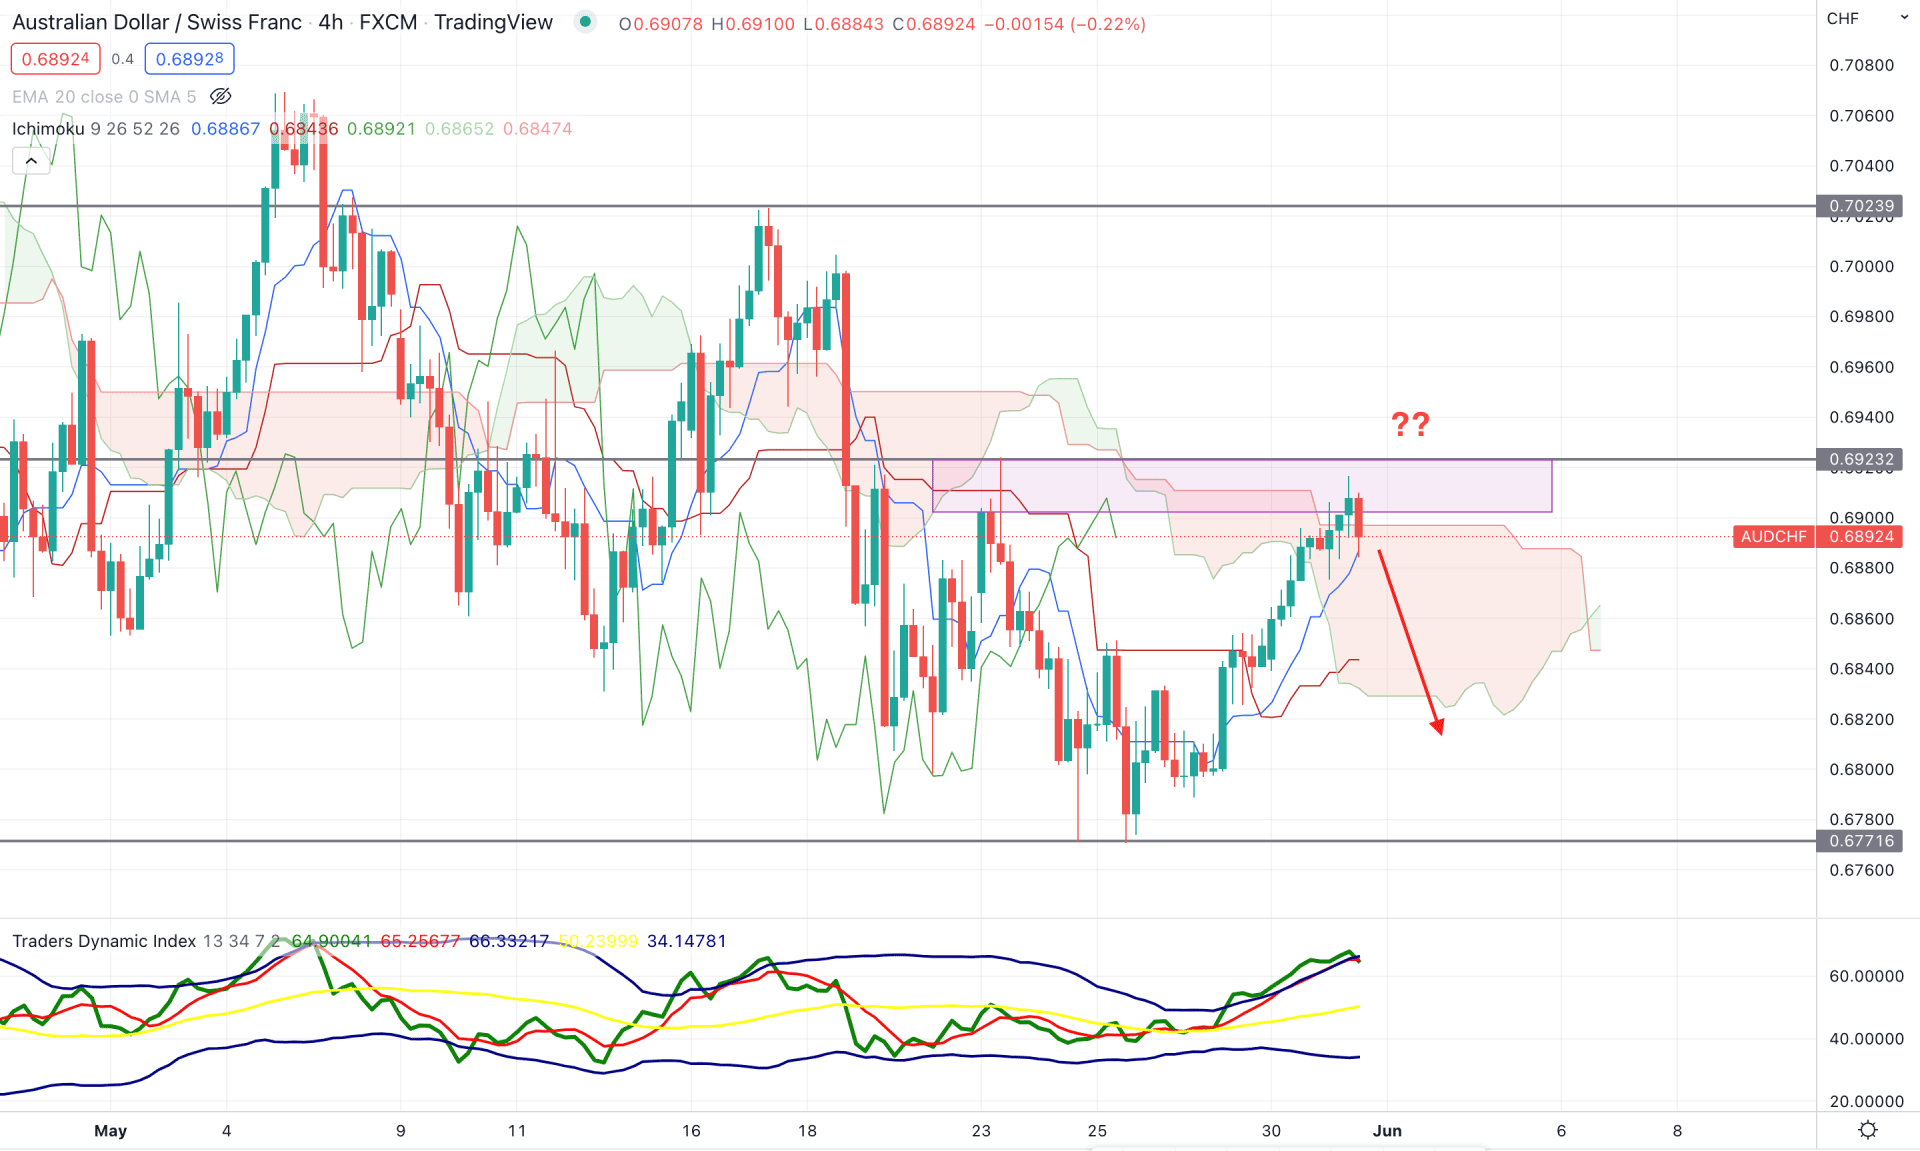
According to the Ichimoku Cloud analysis, the AUDCHF H4 chart is trading at the Cloud resistance while the future cloud shifted its direction. Although the Senkou Span A is above the Senkou Span B in the future cloud, the current price faces a selling pressure from the 0.6923 static resistance in the H4 timeframe. Moreover, the existing selling pressure below the Kumo Cloud came with an impulsive momentum, which is still indicating a solid seller presence in the chart.
The above image shows the H4 chart of AUDCHF, where the current TDI level in the indicator window reached the upper band, indicating that bulls have found the top. On the other hand, there is a wide gap between the dynamic Tenkan Sen and Kijun Sen, indicating that a mean reversion on the sellers' side is pending where the price may correct towards the dynamic Kijun Sen line.
Based on the H4 context, investors should closely monitor how the price trades below the 0.6923 resistance level where a bearish H4 close below the dynamic Tenkan Sen would be a sell signal in this pair. On the other hand, the alternative approach is to wait for a bullish break of structure above the 0.6930 area before considering it as a buy towards the 0.7023 level.
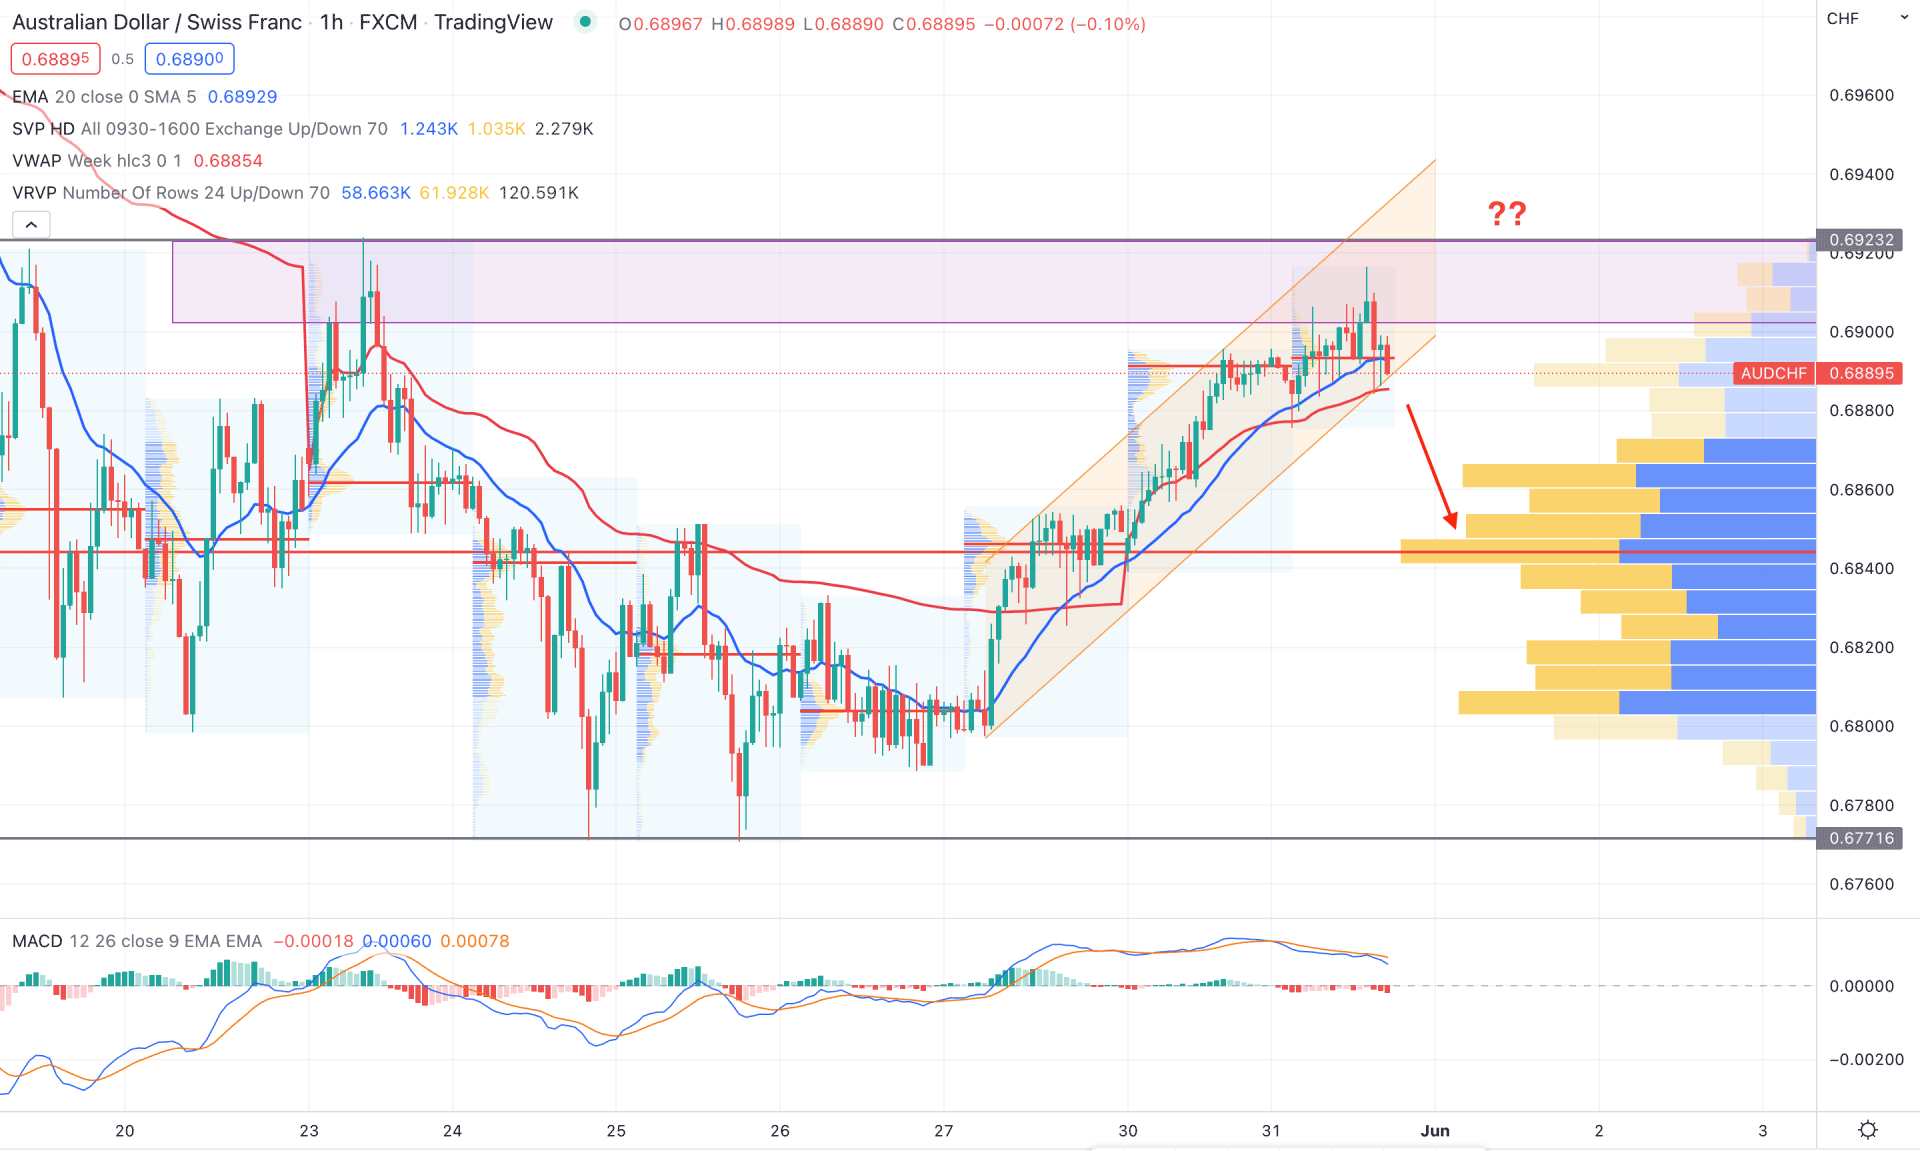
According to the AUDCHF intraday price analysis, the current selling pressure from the 0.6923 double top pattern waits for validation from the channel breakout. Moreover, the dynamic 20 EMA is still below the price where a strong bearish candle is needed to consider it a trend change. According to the volume profile analysis, the highest trading volume from the visible range is at the 0.6805 level, below the current price. Although there are some lower lows in the intraday volume, bulls may attempt again to take the price up if the price shows a strong bullish rejection at the 0.6805 area.
The above image shows how the price trades at the channel support, where the dynamic weekly VWAP works as a primary barrier for sellers. On the other hand, the MACD Histogram turned bearish with a divergence in MACD lines. Therefore, the primary trading approach in this pair is to wait for a bearish H1 candle below the channel support to consider it as a sell towards the 0.6805 high volume level. On the other hand, a bullish opportunity would be a buyer's attempt with a strong bullish candlestick formation from 0.6800 to 0.6820 area.
As per the current market context, AUDCHF is likely to extend the bearish pressure as the intraday price is trading below the 0.6923 resistance level. Investors should wait for a confirmation candle below dynamic support areas before going short in this pair.