
Published: May 29th, 2020
Across the board, the Australian Dollar staring to feel very confident. This could be the continuation of AUD uptrend in the medium to long term. Today, we’ll talk about AUD/USD specifically, because it is the most popular AUD currency pair.
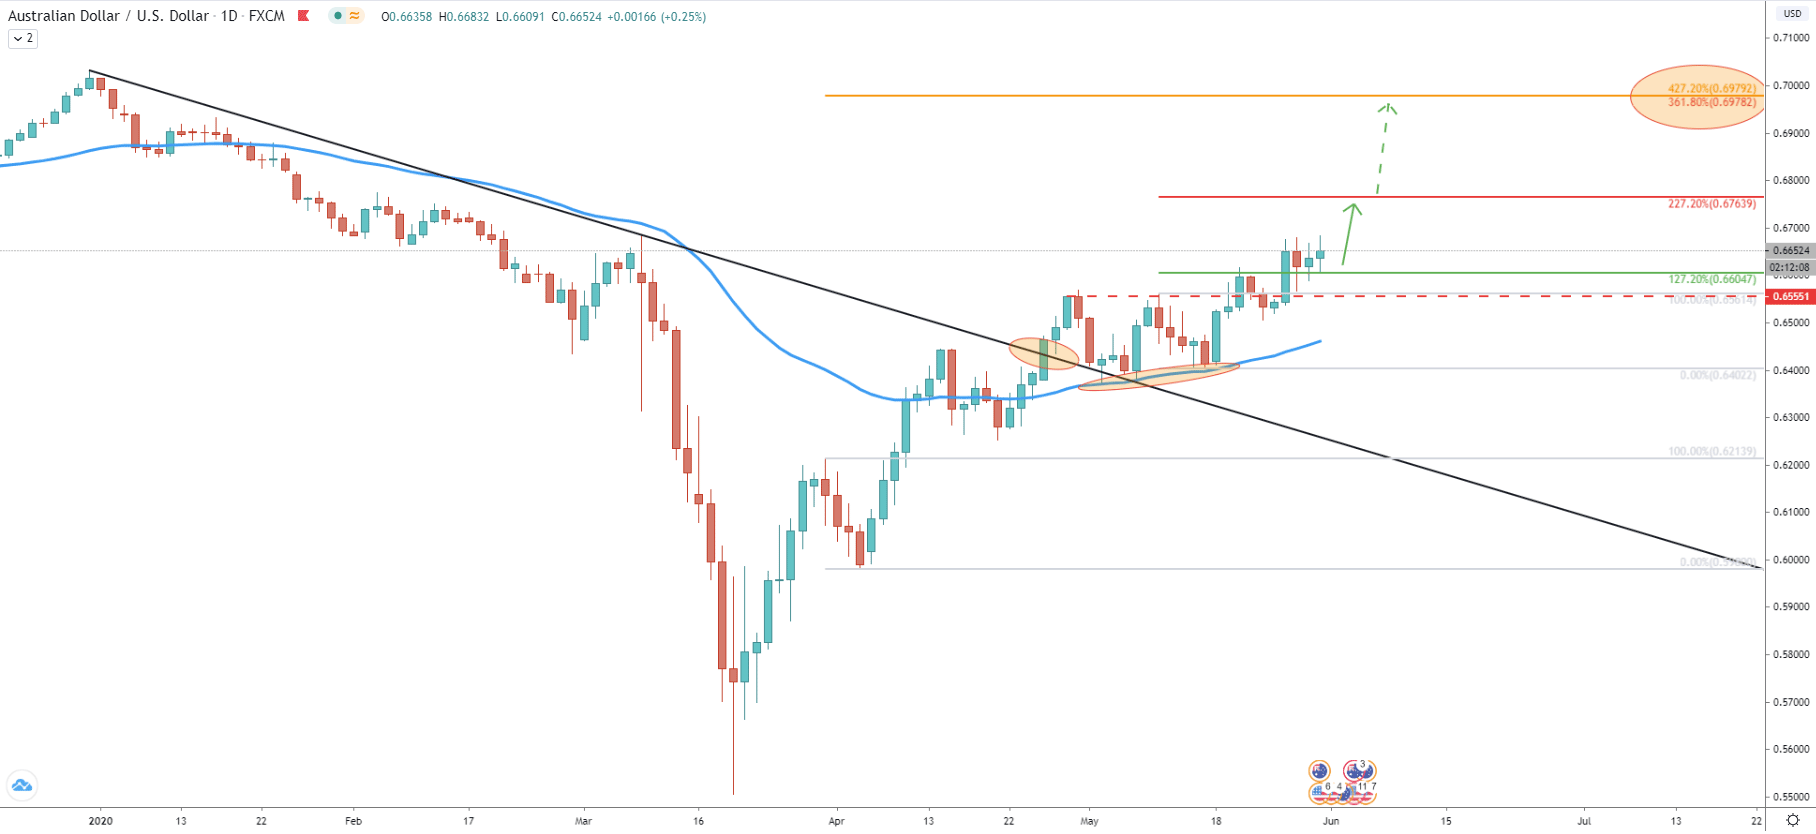
The Daily chart shows that price has managed to break above the downtrend trendline along with the 50 Exponential Moving Average. This was the very first signal of the AUD/USD bullish intentions. After the breakout pair corrected down and rejected 50 EMA two times in a row. Then, the price continued to produce higher highs and higher lows, yet again confirming the validity of the uptrend. The Fibonacci indicator applied to the corrective wave down, where AUD/USD rejected the 50 EMA for the last time, shows potential upside targets. The key resistance is located at 227.2% retracement level, which is at 0.6764. However, if the price manages to break and close above on the daily chart, this could push the price much higher, potentially towards 361.8% Fibs at 0.6978. In the next charts, we will dive deeper into the upside targets.
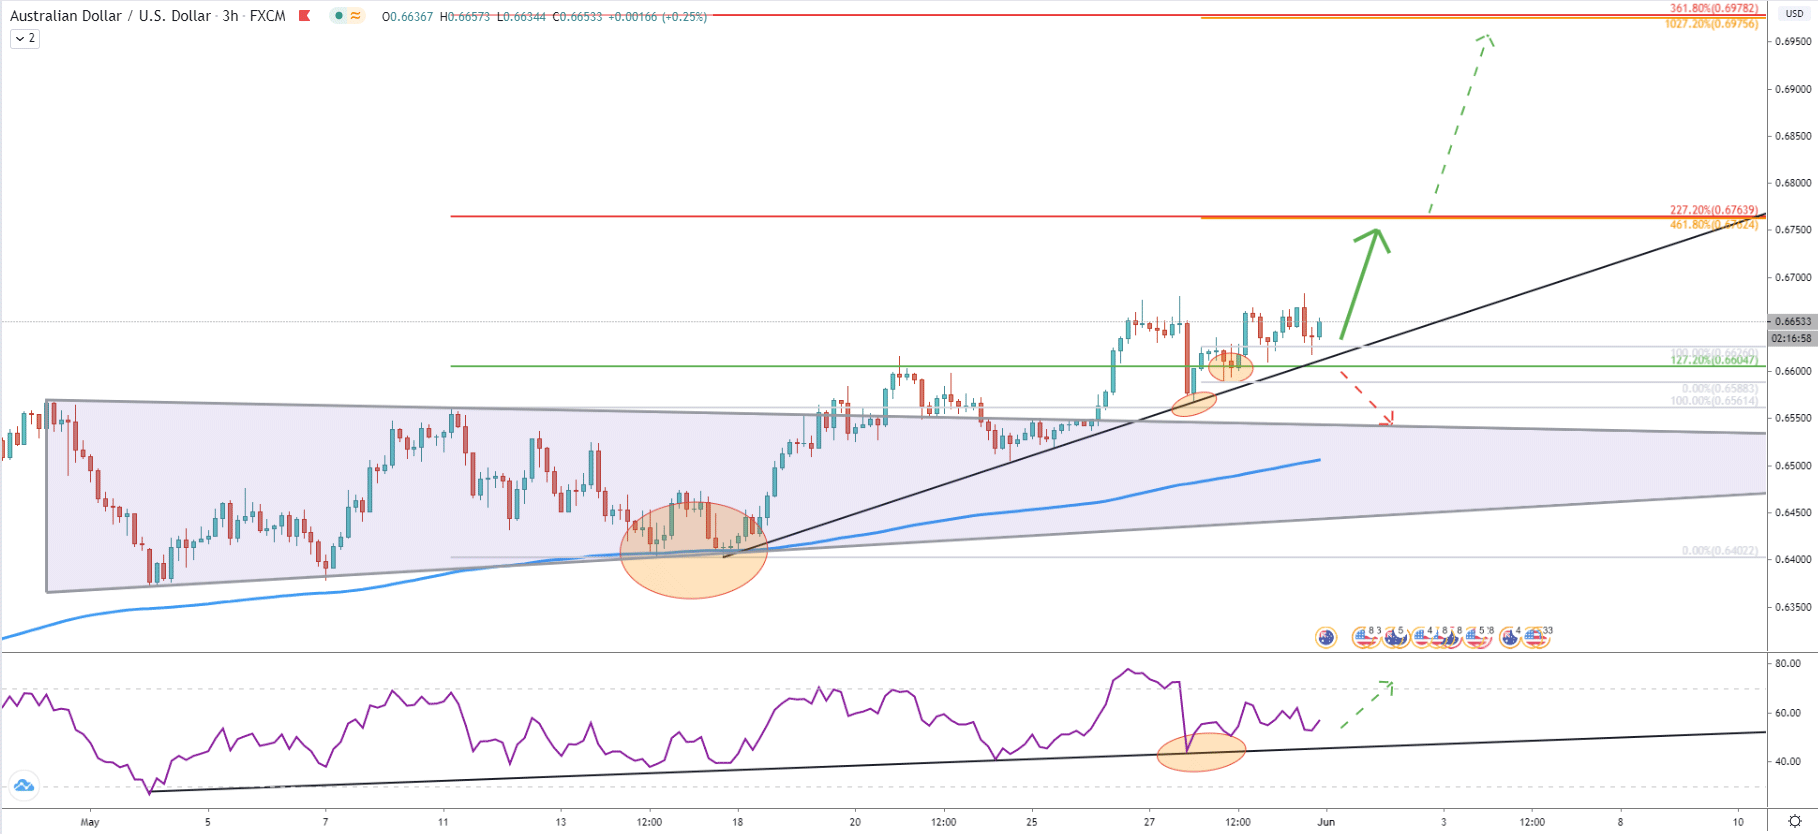
The 3-hour chart shows the rejection of the 200 EMA for two consecutive times. This was the last point of rejection of the lower trendline of the triangle pattern. On May 19, the price finally broke above the triangle, yet again confirming the uptrend. Higher highs and higher lows followed, and the most recent correction down resulted in the rejection of the uptrend trendline. The rejection was very clean, after which price produced a new high. The RSI oscillator also rejected the uptrend trendline, suggesting price strength. On this chart, we have applied another Fibonacci retracement level to the corrective wave down where 127.2% Fibs support level was rejected. We can see that both upside targets now correspond to two Fibonacci retracement levels, making them the key profit taking areas.
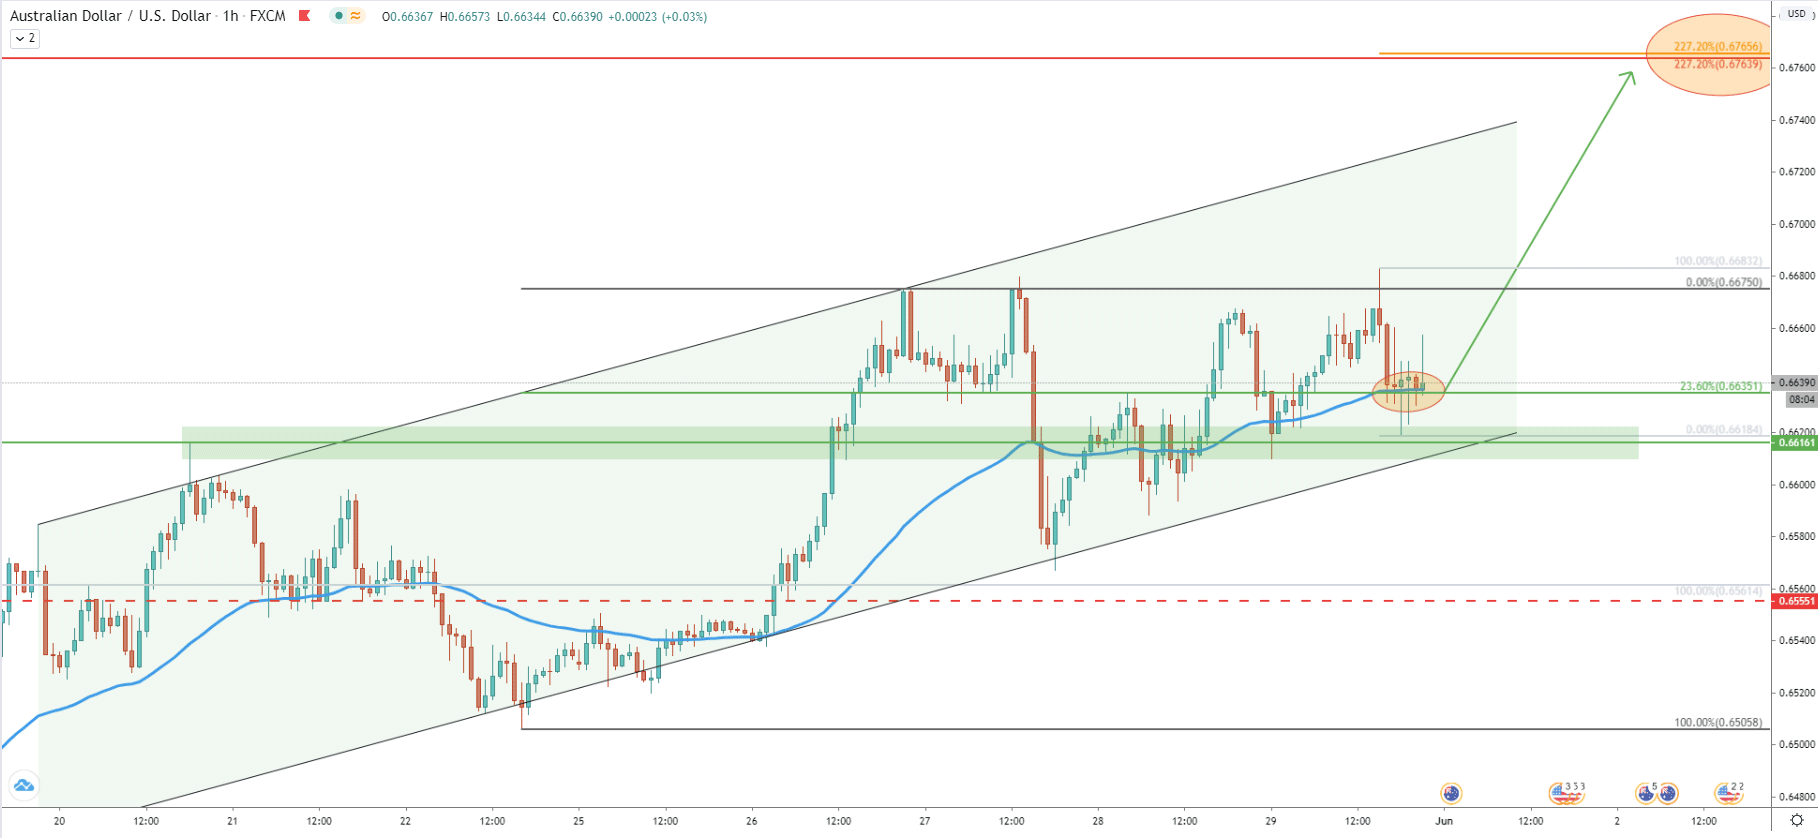
Moving on to the hourly chart, it becomes clear that price continues to trade up within the ascending channel. On May 27, AUD/USD has reached and rejected the lower trendline of the channel after which managed to produce a new high. The most recent correction was defended by the 23.6% Fibonacci retracement level, along with the 50 Exponential Moving Average. Both of these support indicators were rejected. Therefore, the low at 0.6618 now plays a very important role, because the break below will indicate a potential trend reversal to the upside. But as long is it holds, AUD/USD nearest upside target remains at 0.6764. Besides, we have applied another Fibonacci retracement indicator to the current downside correction, where 227.2% Fibs corresponds to the previously discussed resistance.
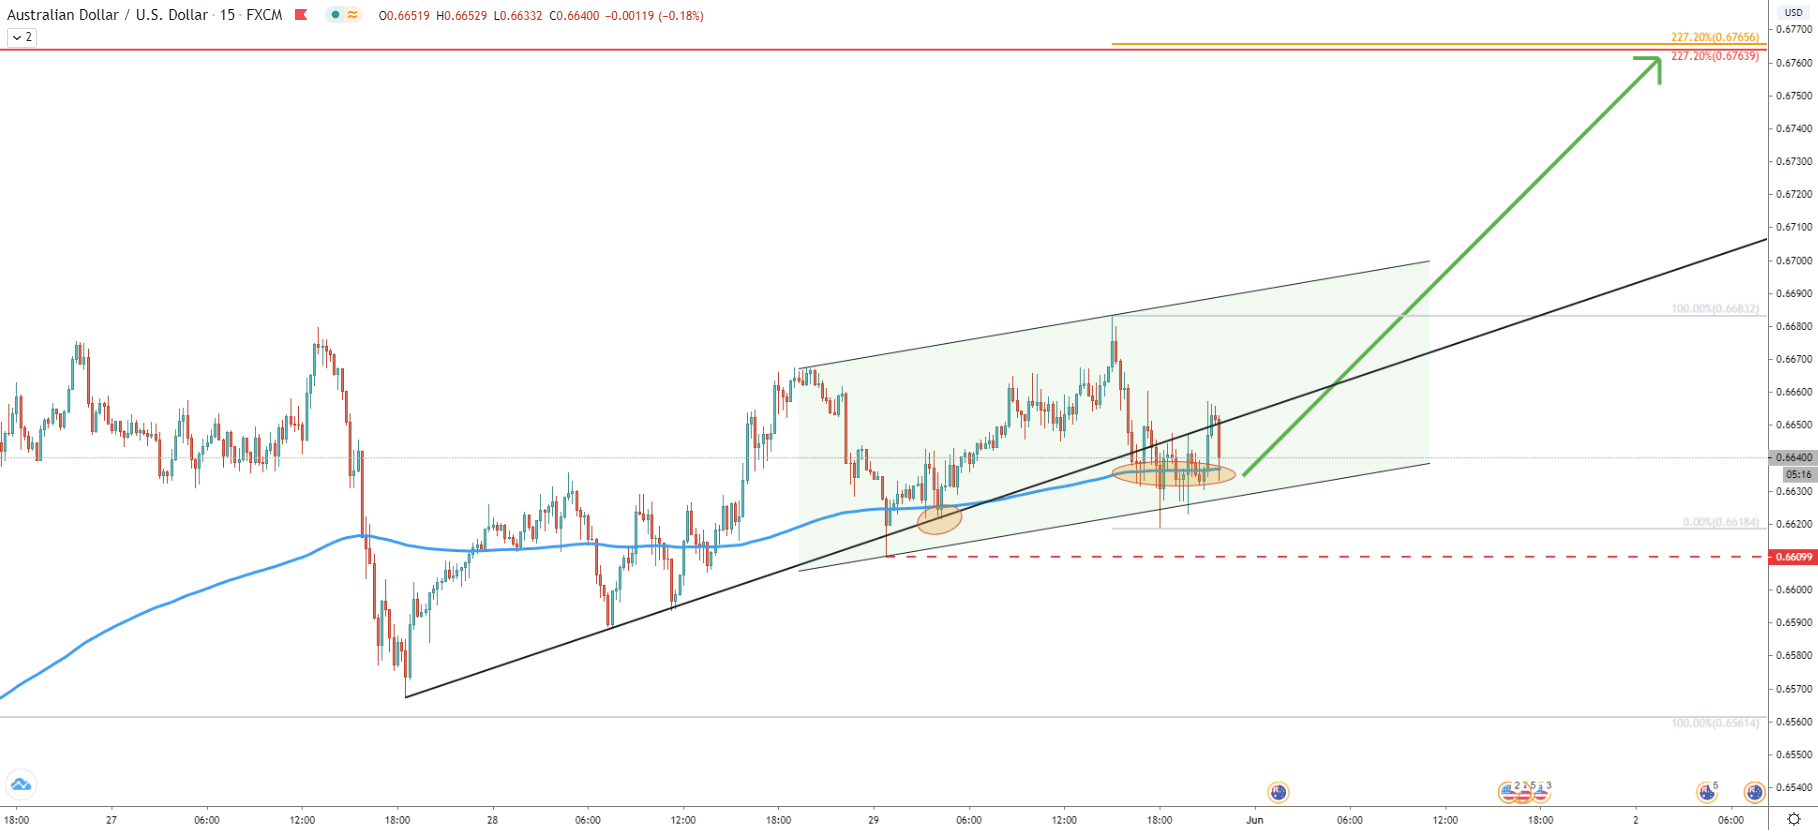
On the 15-minute chart, we have the similar price action to the one on the 1-hour chart. Price is moving within the ascending channel and today there was a bounce off the bottom of the channel. At the same time, the 200 EMA was rejected, confirming the heavy domination of buyers on AUD/USD. The last point of rejection of the uptrend trendline was at 0.6609. This is very close to the 0.6600 psychological support. This means that while the uptrend is ongoing, the price might spike down to re-test this level.
On all timeframes analyzed, there are multiple confirmations on the validity of the uptrend. Price rejected EMAs price stays within the ascending channel on two timeframes. Right now, AUD/USD is at the bottom of both channels, which could be the starting point of yet another wave to the upside.
As per the 3-hour chart, there are two resistance levels, each of them could end the uptrend. The first is at 0.6764 and the second is at 0.6975. Both of them are confirmed by multiple Fibonacci retracement levels, but the nearest target should play the most important role in further price development.
As per the 15m chart, today’s low at 0.6618 is the key technical support, but, 0.6600 must be watched with greater attention, as it is key psychological support. Daily break and close below the 0.6600 would invalidate bullish outlook and AUD/USD is highly likely to change the direction of the long term trend, from up to down.
Support: 0.6618, 0.6600
Resistance: 0.6683, 0.6764, 0.6975