
Published: July 13th, 2020
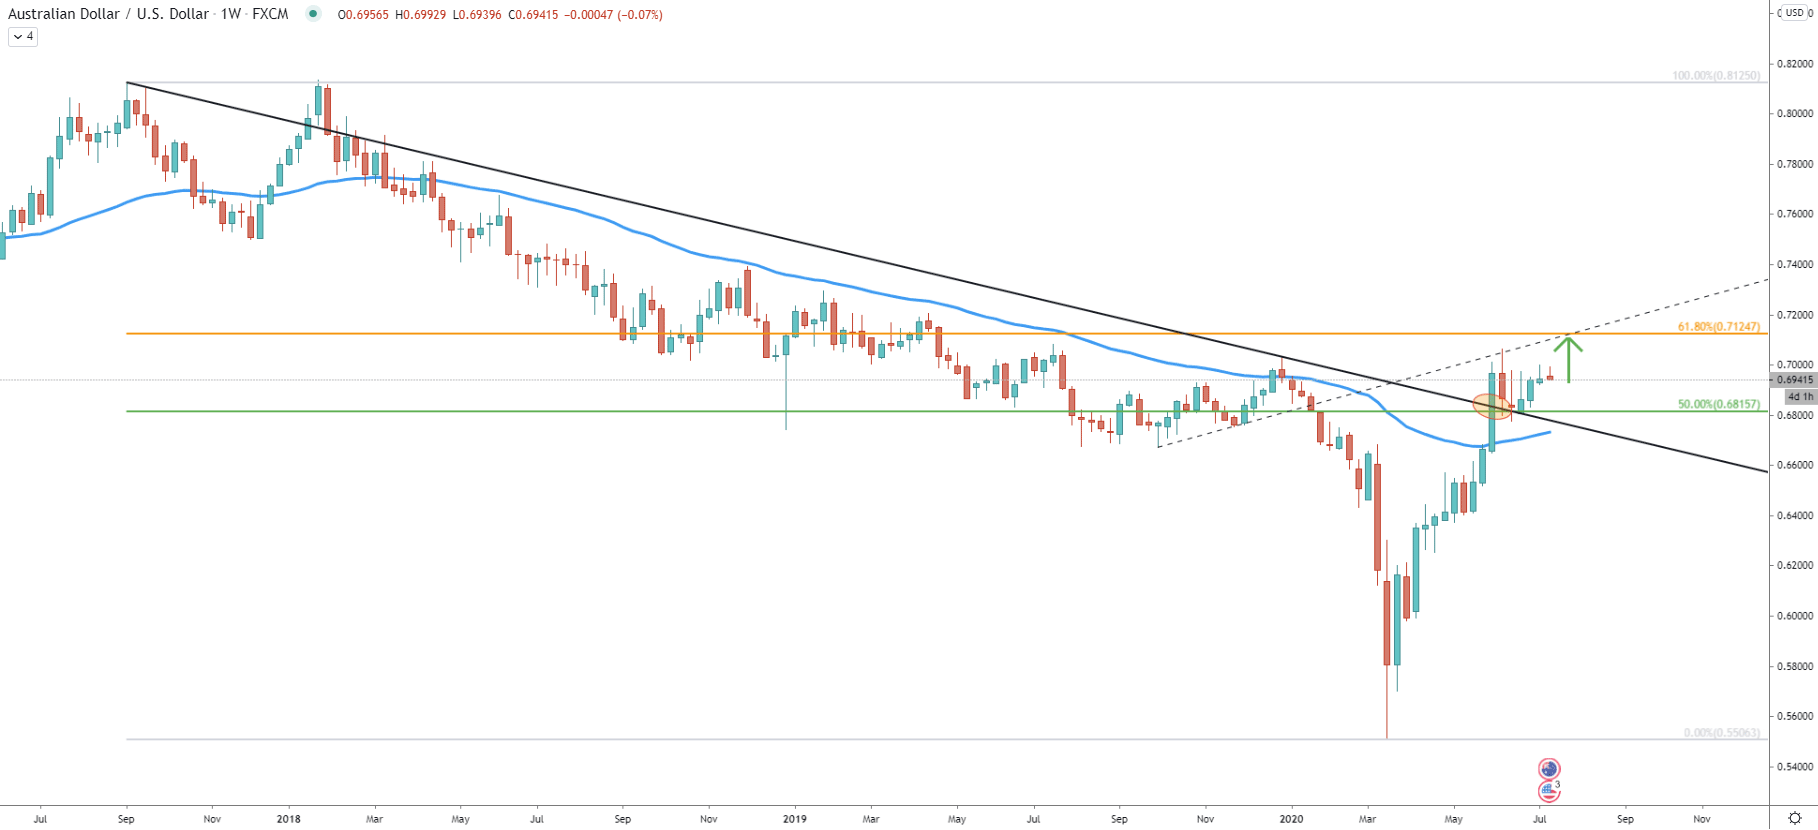
On March 16, AUD/USD has bottomed out while testing 0.5506 low. Since then pair has recovered by 26% and currently trading near 0.6940 level. During the first week of June, the price has gone up substantially and broke above the long-term downtrend trendline as well as 50 Exponential Moving Average.
Such price action might suggest strong buying pressure for AUD/USD, which means that the uptrend is not over yet. Fibonacci applied to the overall downtrend shows the nearest support and resistance levels. The support is seen at 0.6815, which is the area of the downtrend trendline break as well as a 50% Fibonacci retracement level. The resistance is at 0.7124, confirmed by 61.8% Fibs as well as the resistance uptrend trendline. If AUD/USD will continue moving north, this could mean a potential 180 pips growth in the coming weeks, or perhaps even days if the trend will be very strong.
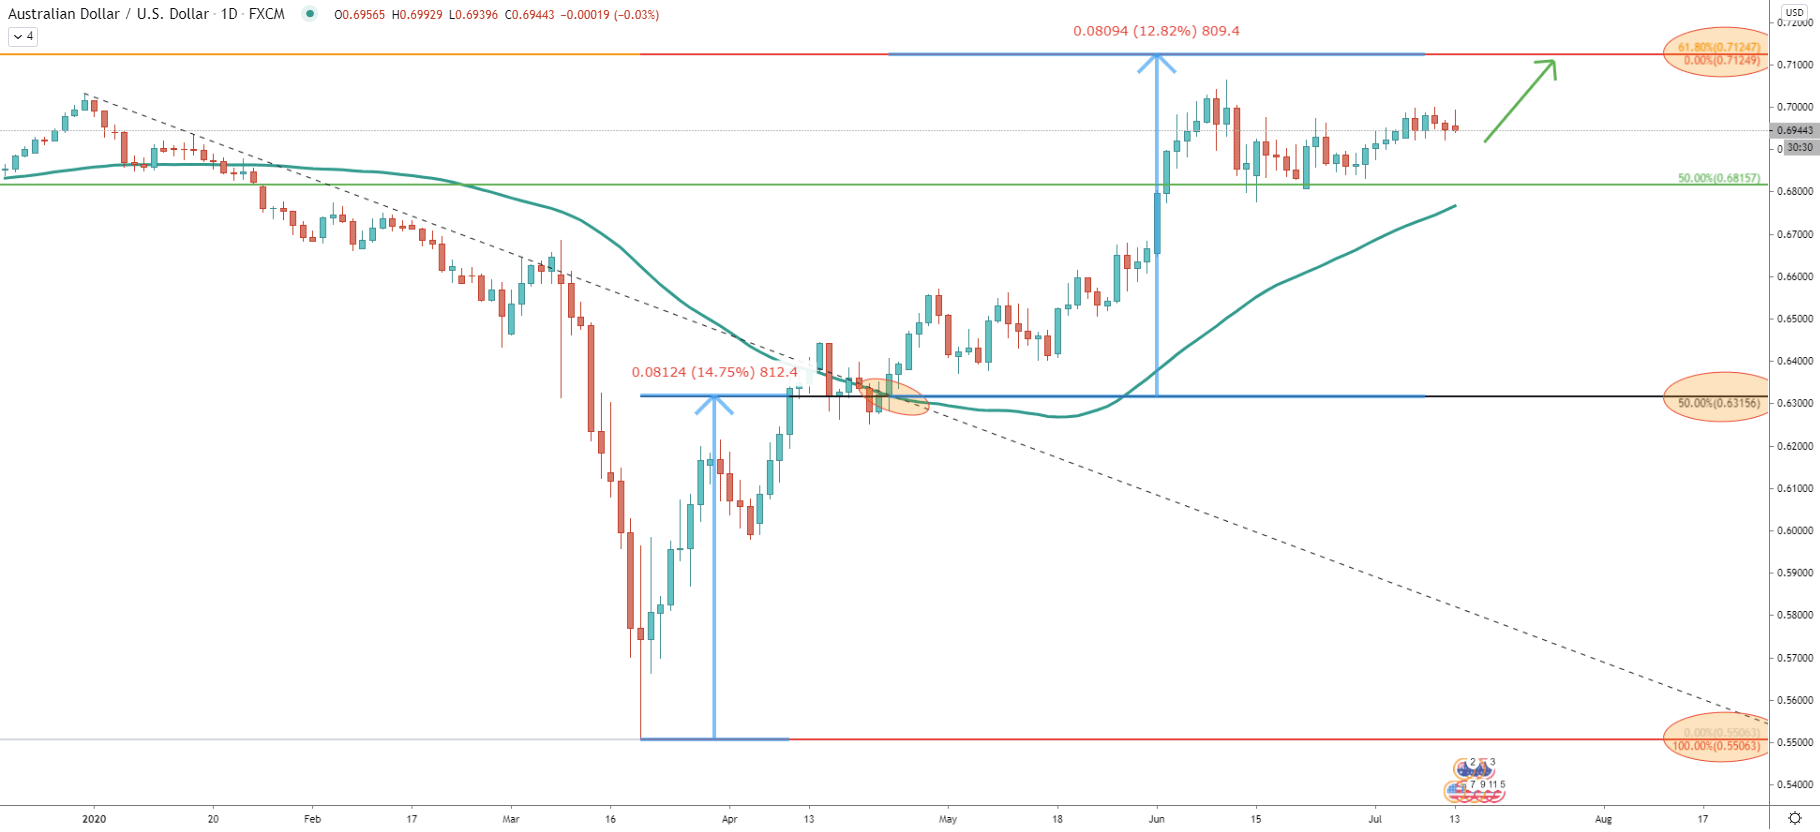
On the Daily chart, we can see the breakout point of another downtrend trendline as well as 50 Simple Moving Average, which was right at 0.6315. We have applied the Fibonacci retracement indicator to this breakout so that 50% is at the breakout point. The idea of such Fibonacci use is to show that the move from the bottom prior to the trendline break, could be equal to the move after the trendline break. Prior to the breakout AUD/USD went up by approximately 810 pips, and the same could be expected after the breakout, another 810 pips move. If this will be the case, the upside resistance is shown on the Weekly chart will also correspond to the 0% Fibs upside target.
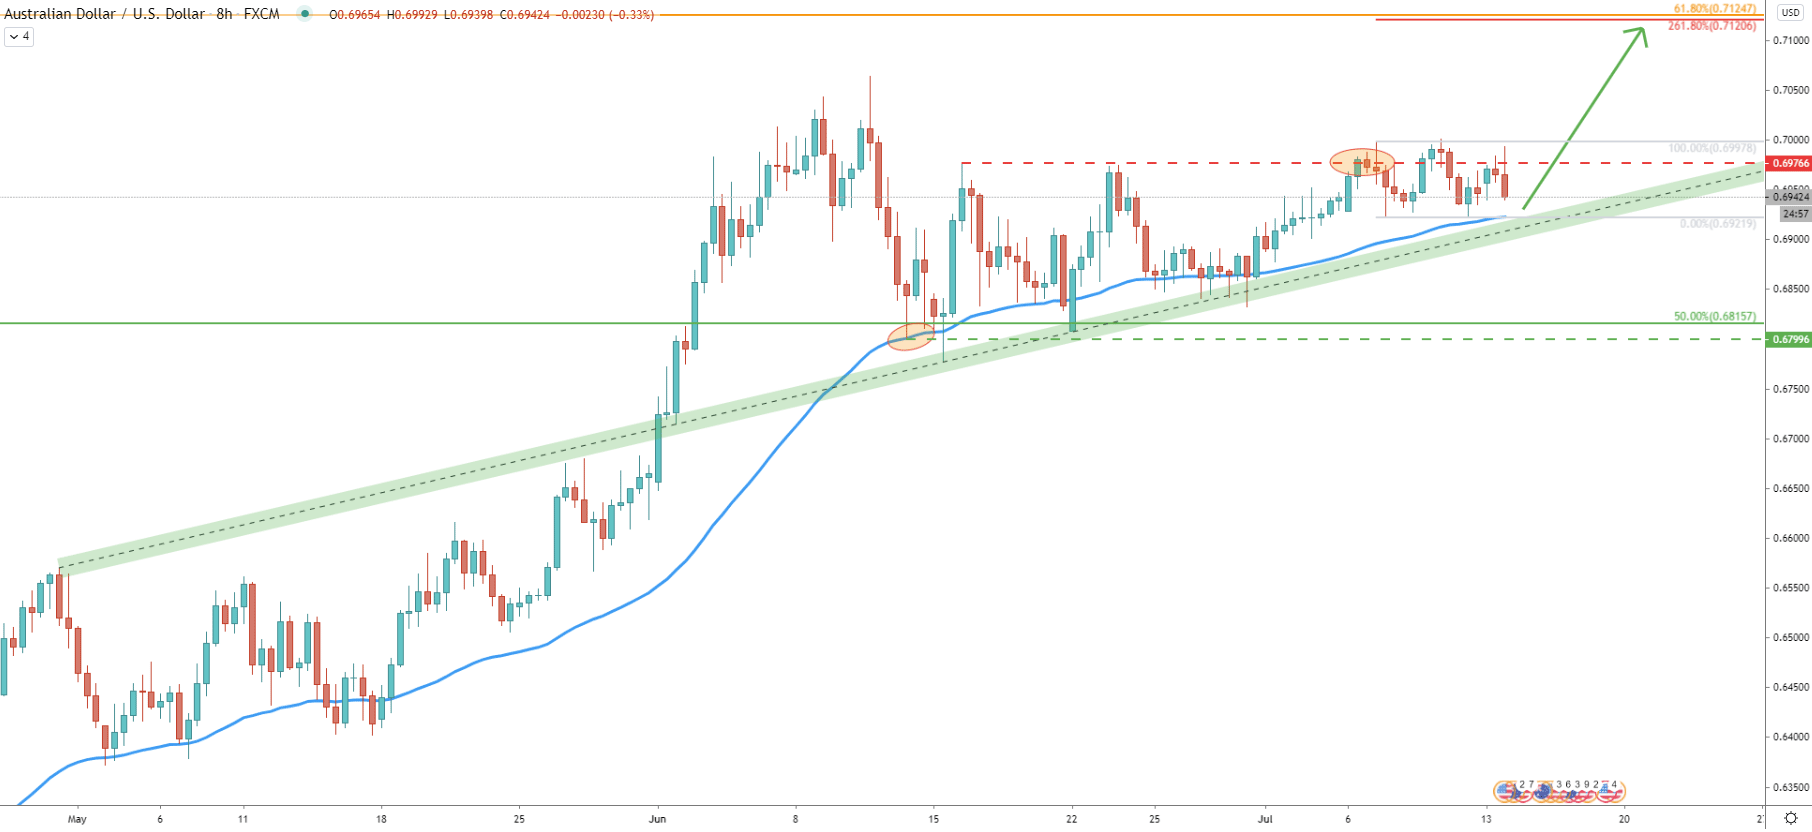
The average-price uptrend trendline is being rejected multiple times, providing strong support for AUD/USD. At the same time price remains above the 50 EMA throughout the entire consolidation phase. On the June 6 price finally broke above the previously established resistance at 0.6976 suggesting further growth. However, after the breakout price started to consolidate once again. Currently, AUD/USD remains very close to the support trendline as well as 50 EMA. This could be a very interesting buying area for bulls as long as price remains above the EMA.
We have applied the Fibonacci retracement indicator to the correction down after the 0.6976 resistance breakout. The 261.8% retracement level almost exactly corresponds to the potential upside target at 0.7124.
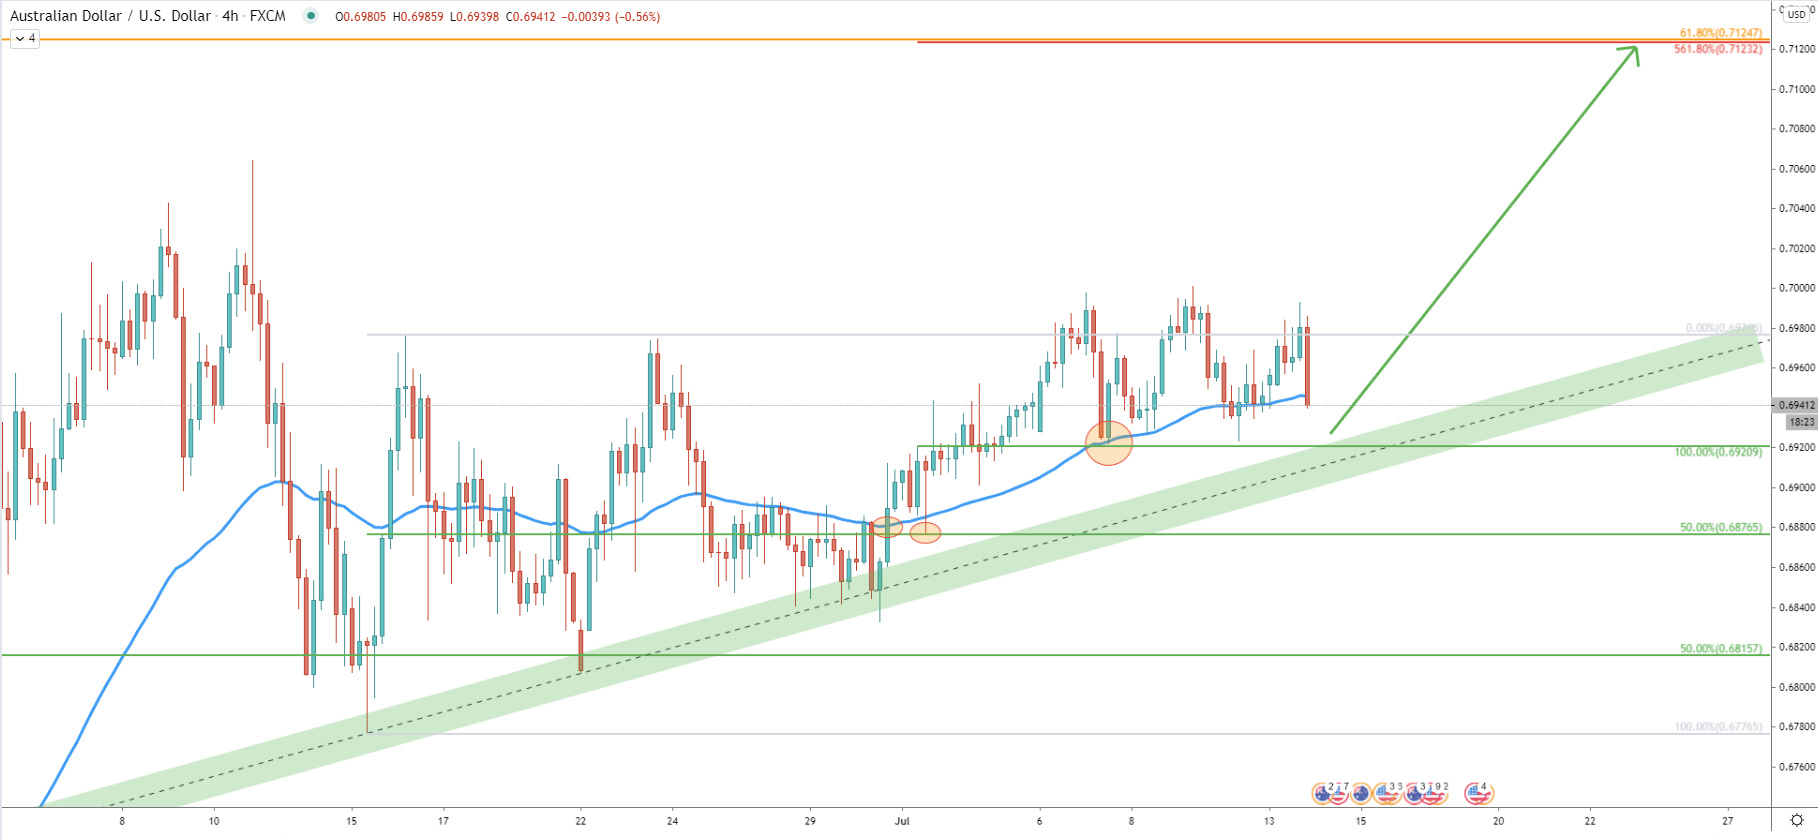
On the 4-hour chart, Fibonacci was applied to the first corrective wave up after rejecting the trendline. After AUD/USD broke above the 50 EMA on June 30, a small pullback followed. On the pullback price cleanly rejected 50% Fibs at 0.6876, marking it as an important support level. Yet again, Fibs were applied to that pullback, where 561.8% retracement level also corresponds to the 0.7124 upside resistance.
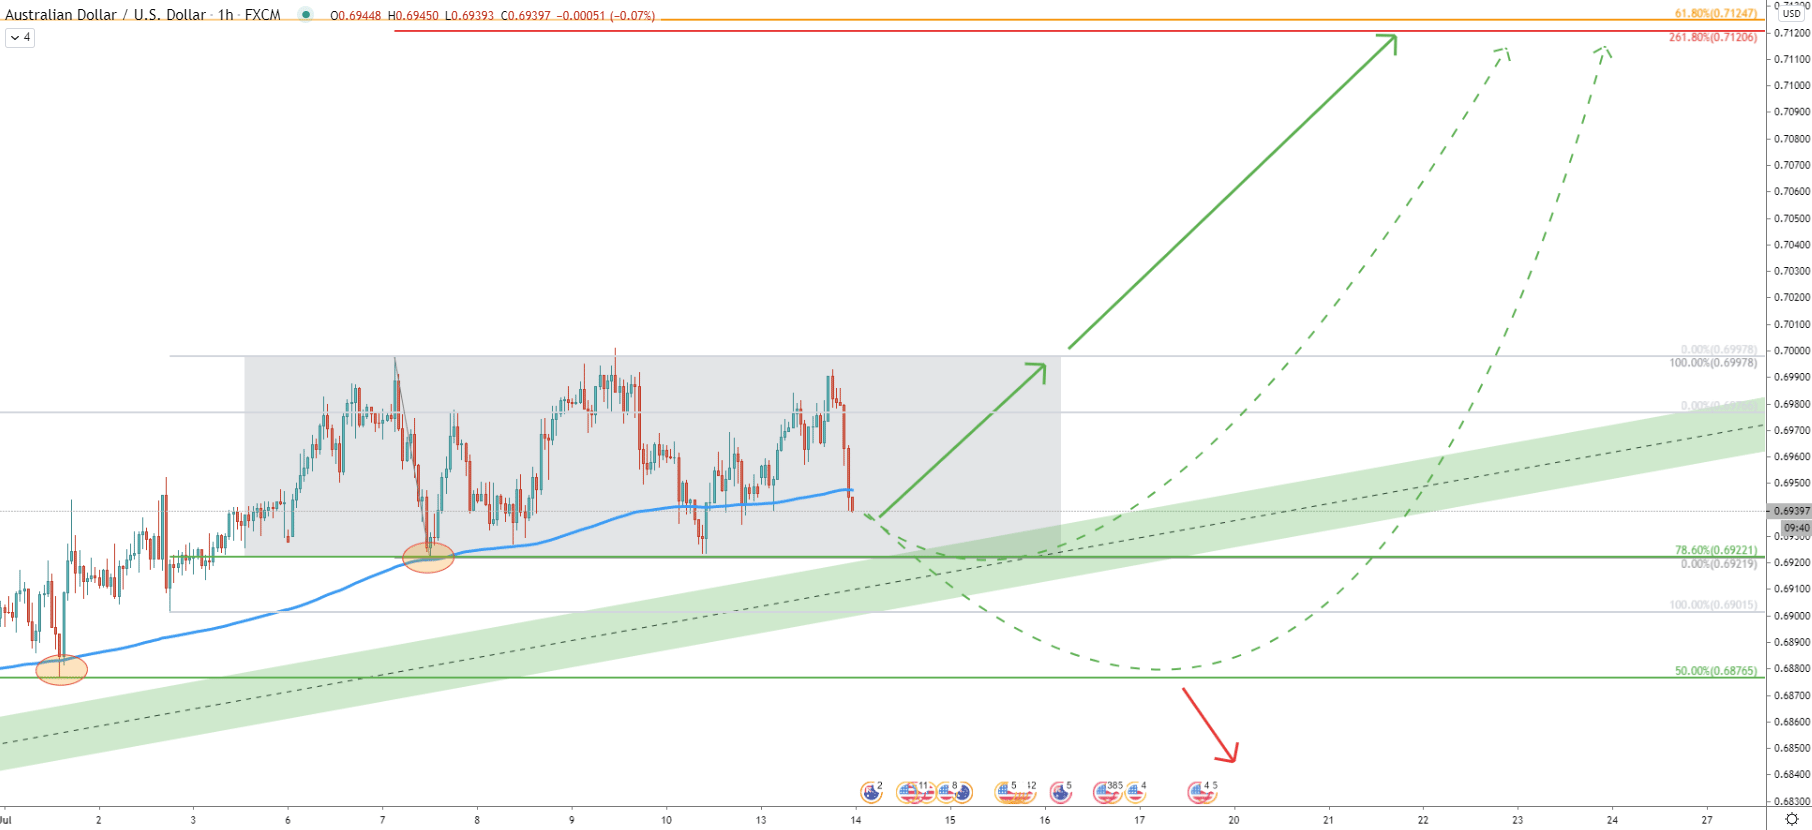
It is clear, that in the shorter timeframe the consolidation is ongoing, where the price is stuck between 0.7000 psychological resistance and 0.6922 support. But what’s interesting is a clean rejection of the 78.6% Fibs applied to the last wave up. The rejection was very precise, marking 0.6922 as another important support level.
The AUD/USD seems to be consolidation in the medium and short term. Although price remains above the 50 and 200 EMA on different timeframes, suggesting the validity of a long term uptrend. Support levels are being rejected and as long as price remains above 0.6876, pair is very likely to continue trending up.
As per every single chart in this analysis, AUD/USD key resistance is located at 0.7120 area and confirmed by 5 different Fibonacci retracement levels.
AUD/USD might attempt to re-test the 0.6922 support and potentially can produce a spike below, before/if the price will continue trending up. Another scenario suggests that price will move even lower, to test 0.6876 support prior to the growth. However, if there will be 1h and 4h closing price below the second support, the bullish outlook will get invalidated, in which case pair might start reversing to the downside.
Support: 0.6922, 0.6876
Resistance: 0.7000, 0.7120