
Published: July 30th, 2020
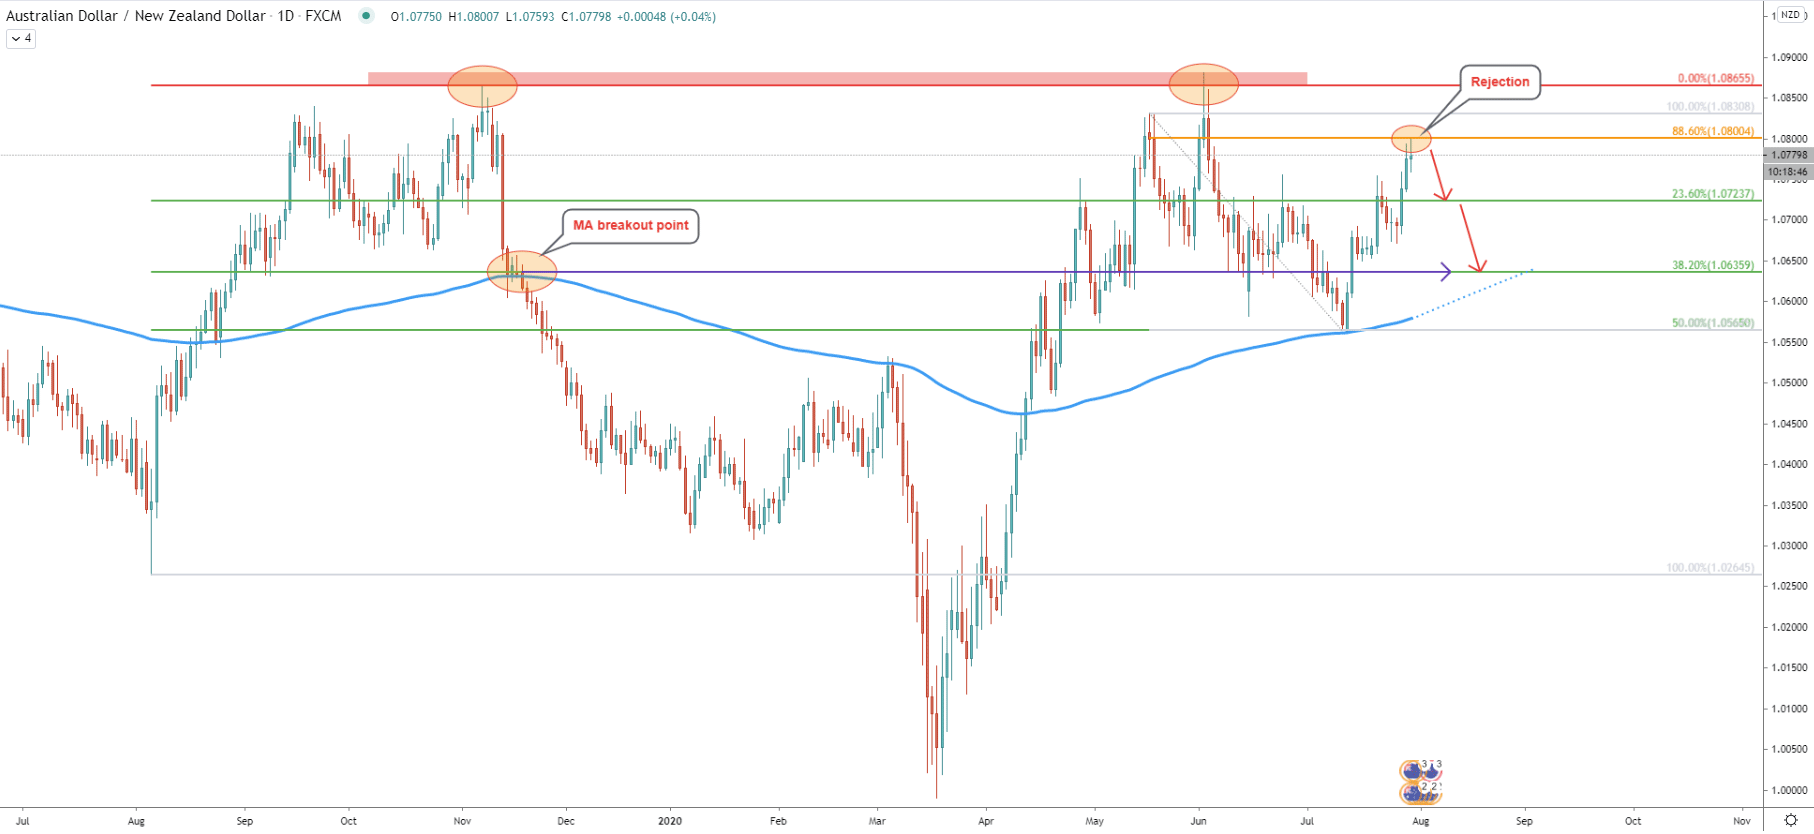
On the daily chart, AUD/NZD has formed a double top near the 1.0865 area back on June 02. The price has corrected down and tested 1.0565 low while rejecting the 200 Exponential Moving Average. Since July 13, AUD/NZD has been on a steady rise and up until now pair has recovered 236 pips (2.24%).
Today AUD/NZD has reached and rejected cleanly 88.6% Fibonacci retracement, right at the 1.0800 key psychological level. Clearly this is an extremely important price for AUD/NZD, and considering the formation of the double top, the probability is changing in favor of the downside move.
As long as daily close remains below 1.0800, pair will most likely start reversing to the downside. Eventually, this might result in the price drop towards one of the Fibonacci support levels. The nearest support is seen at 1.0726, which is 23.6% Fibs. But the second, and most important support level is located at 1.0636. This support is confirmed by 38.2% Fibs and extended Moving Average, not to mention that previously this level was a point of the 200 EMA breakout.
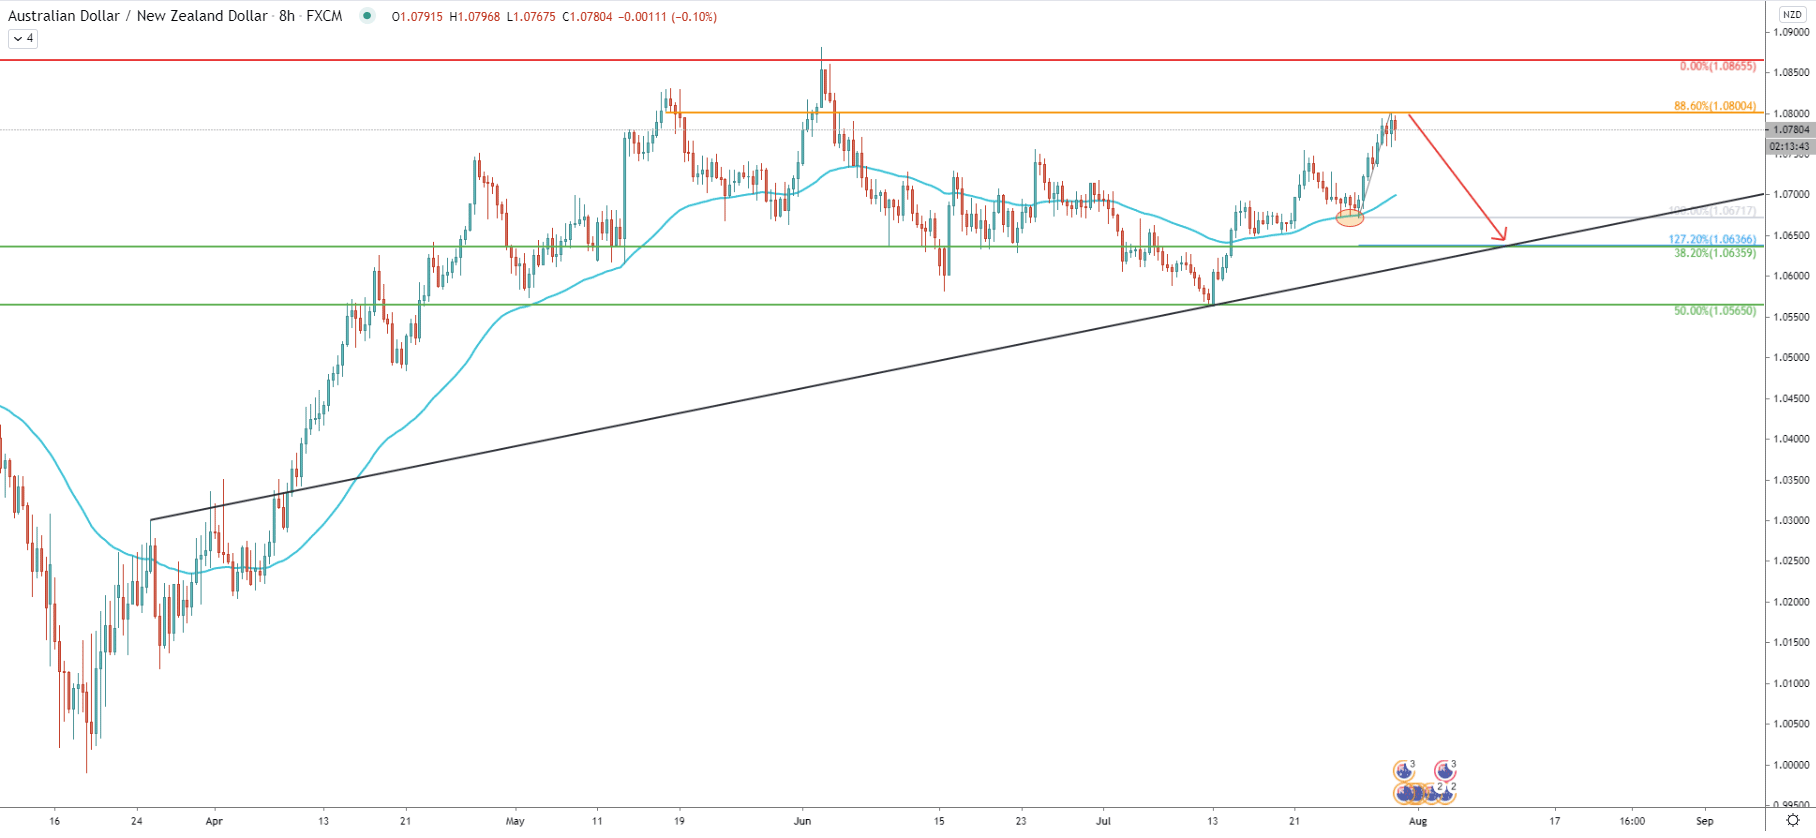
On the 8-hour chart, the Fibonacci indicator was applied to the most recent upside swing, where 88.6% Fibs was rejected. The 127.2% retracement level cleanly corresponds to the previously mentioned support at 1.0636. At the same time, it goes in line with the average-price uptrend trendline. Based on the time when the trendline is crossing with the 1.0636 support, the downside target could be reached as soon as August 10, which is just 7 trading days away.
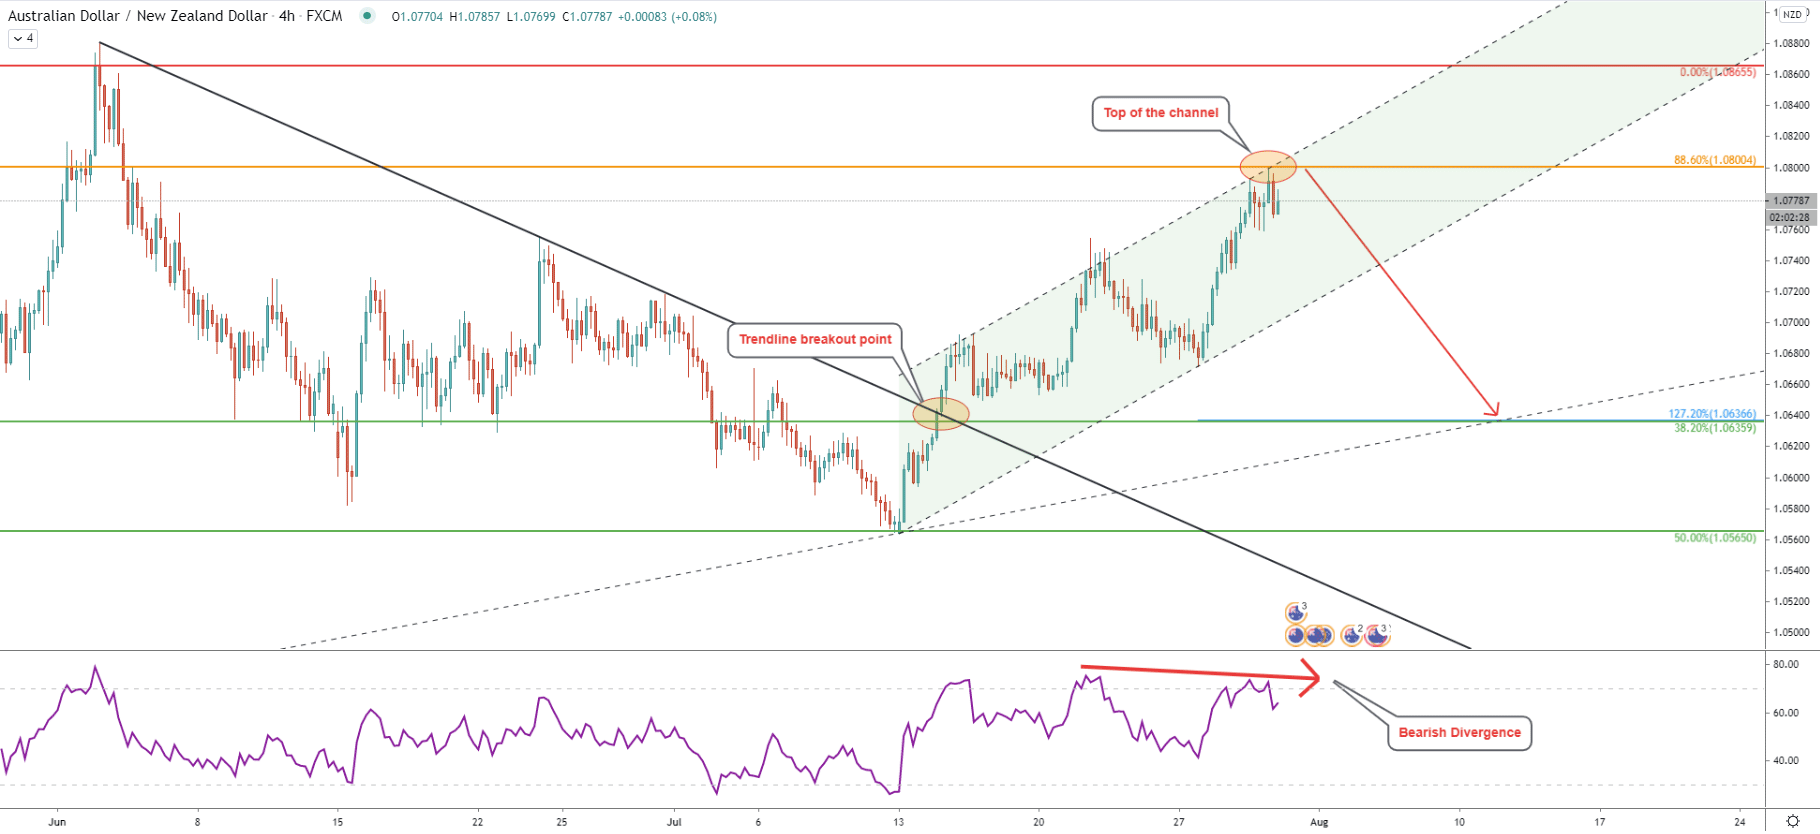
Here we can see that price has reached the top of the ascending channel. The upper trendline has been rejected cleanly along with the 88.6% Fibs simultaneously. The RSI formed a bearish divergence suggesting correctional downside wave.
Price still might spike above the 1.0800 resistance, but the most important is that daily close will remain below this price. In this case, AUD/NZD will either consolidate for a few days before/if the move down, or the downtrend will start immediately. The downside target on this chart almost precisely corresponds to the point of the downtrend trendline, making 1.0640 an extremely strong demand zone.
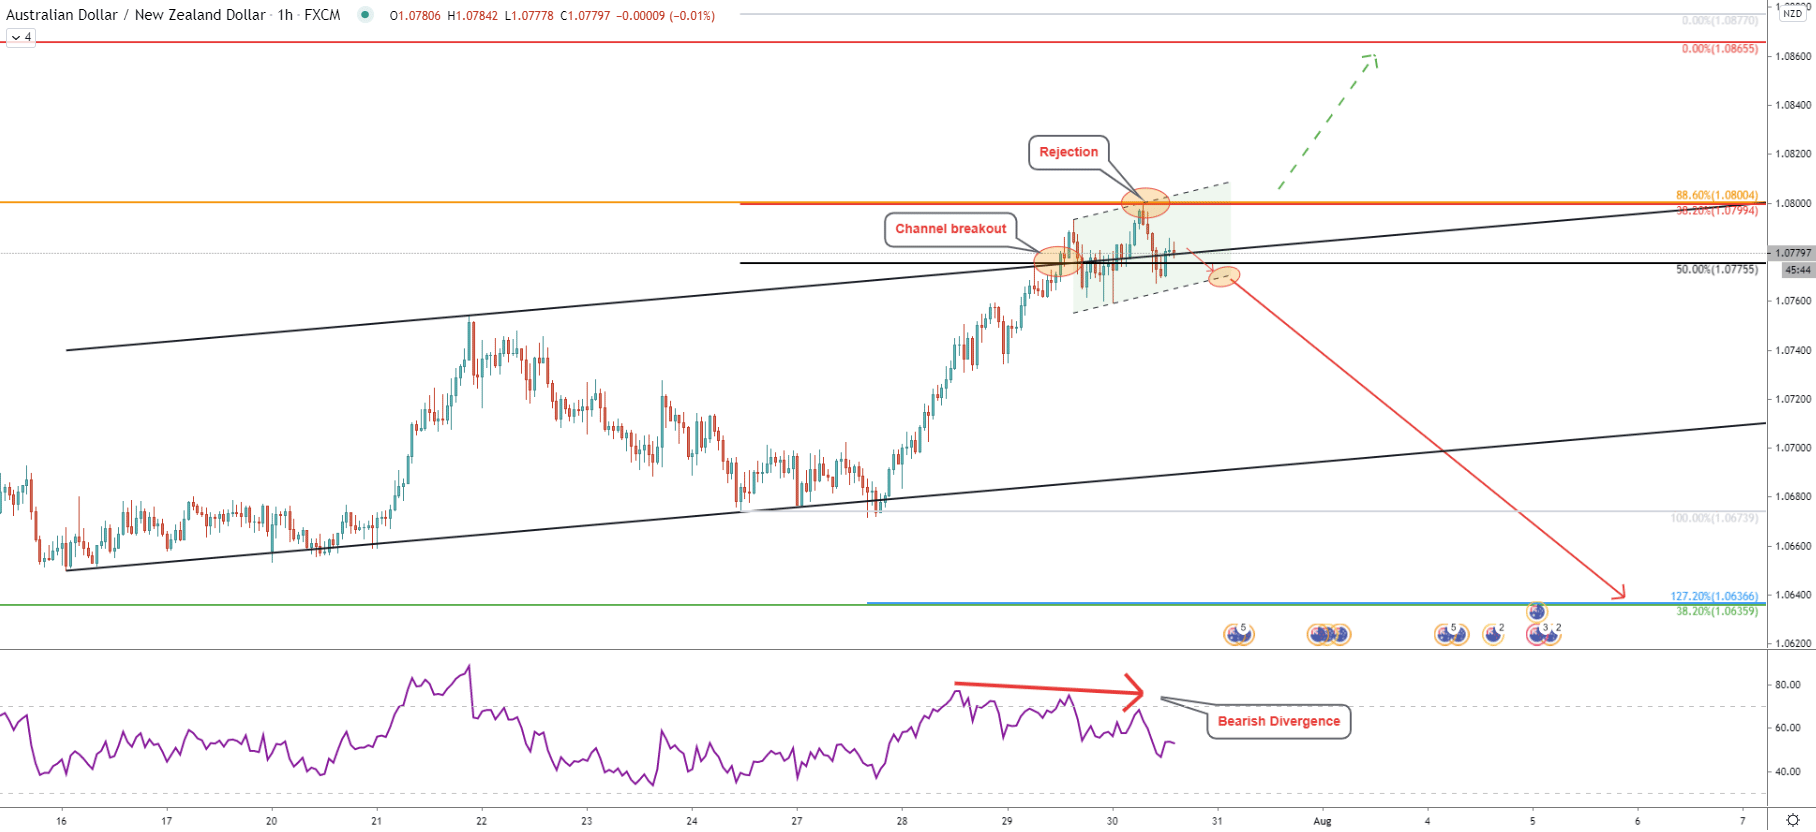
On the hourly chart, the price has been moving within the ascending channel. On July 29 AUD/NZD broke above the channel and tested 1.0800 high, while the RSI yet again formed a bearish divergence. We have applied the Fibonacci retracement indicator to the channel breakout point. The 38.2% retracement level precisely corresponds to the previously mentioned key psychological resistance at 1.0800.
Perhaps all these facts ads supper confidence that the correctional wave down is imminent. But during such times the possibility of spikes above the resistance is extremely high. For this reason, sellers could be waiting for another signal which might be the breakout of the ascending channel on the lower timeframe.
AUD/NZD rejected key psychological resistance along with multiple technical indicators at 1.0800. The RSI formed a bearish divergence on two different timeframes, suggesting a trend reversal. As long as daily close remains below the resistance, AUD/NZD price can be expected to drop by approximately 140 pips within the next 7 trading days.
As per the 8-hour chart, the key support is located at 1.0636, which is confirmed by two Fibonacci retracement levels, an average-price uptrend trendline, and the extended 200 Exponential Moving Average. Nonetheless, there is also minor support at 1.0723, which must be broken for the price to move lower towards the expected key support.
As per the hourly chart, the key resistance is seen at 1.0800. The price might produce spikes above this level but then close below the support. In this scenario, the bearish outlook can only be invalidated if there will be a daily close clearly above all spikes produced previously. When/if this occurs, AUD/NZD will most likely continue trending up to the test 1.0865 area. Upon the breakout of this level, the long-term uptrend could be confirmed.
Support: 1.0723, 1.0636
Resistance: 1.0800, 1.0865