
Published: February 13th, 2020
In today’s’ analysis we will look at AUD/NZD pair on Daily, 4-hour, 1-hour and 15-minute charts. Under current circumstances, there might be a good risk/reward buying opportunity right now. But let’s get into those circumstances starting by analyzing a Daily chart.
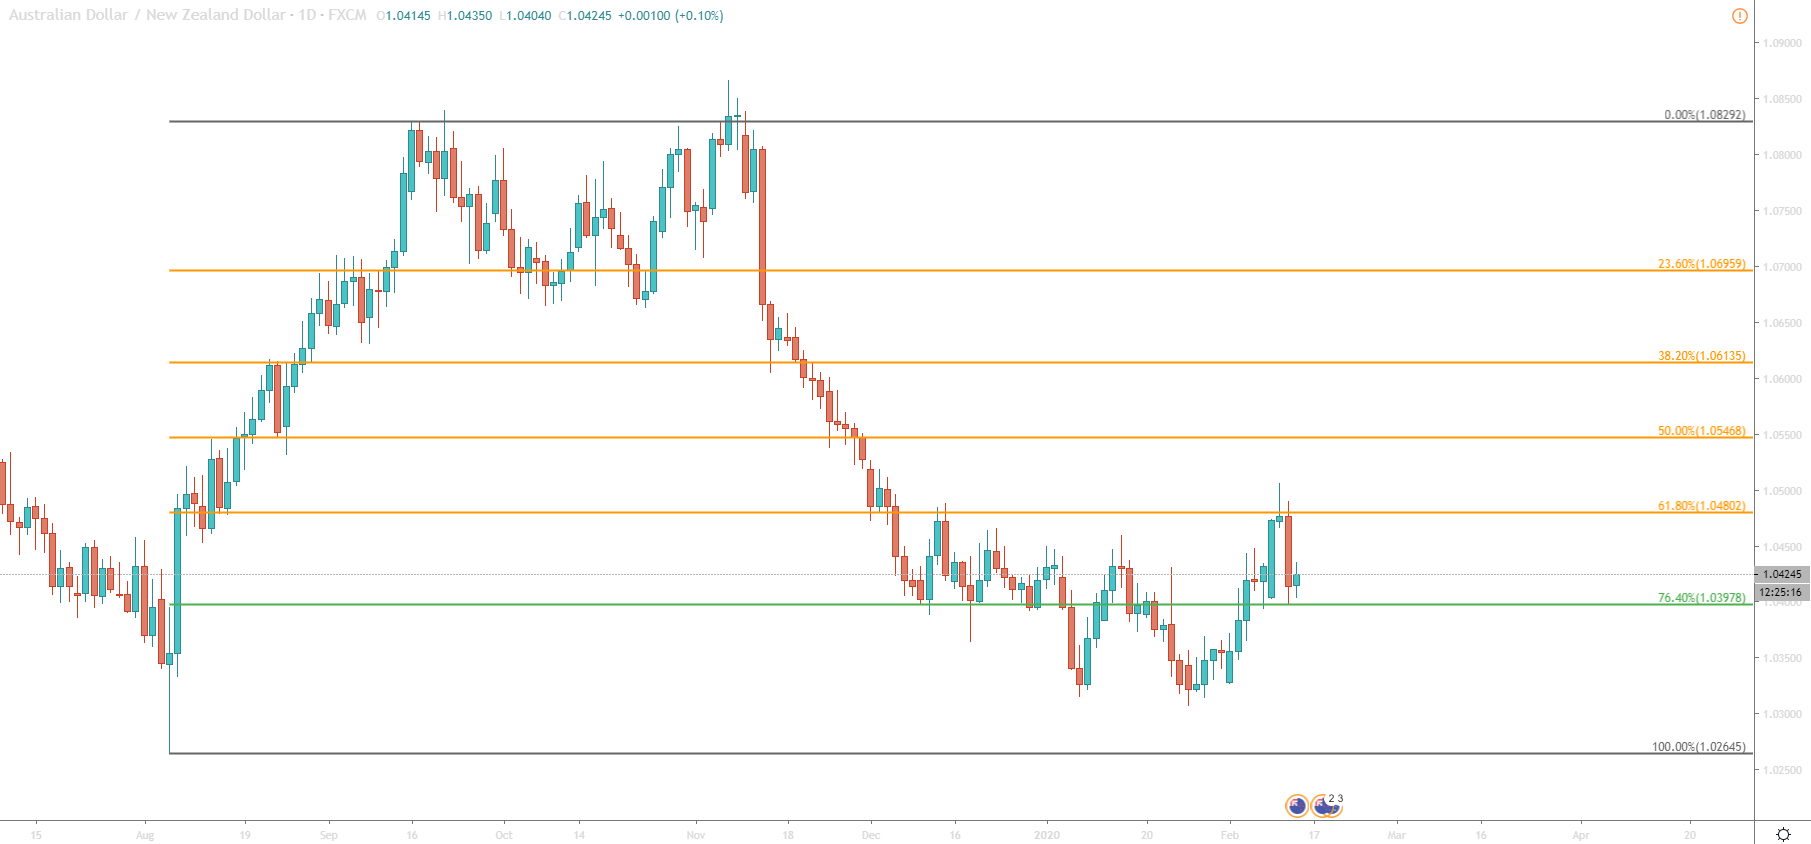
On this chart, we have applied the Fibonacci retracement level to the August - September 2019 uptrend to show support and resistance levels. Time to zoom in the lower timeframe.
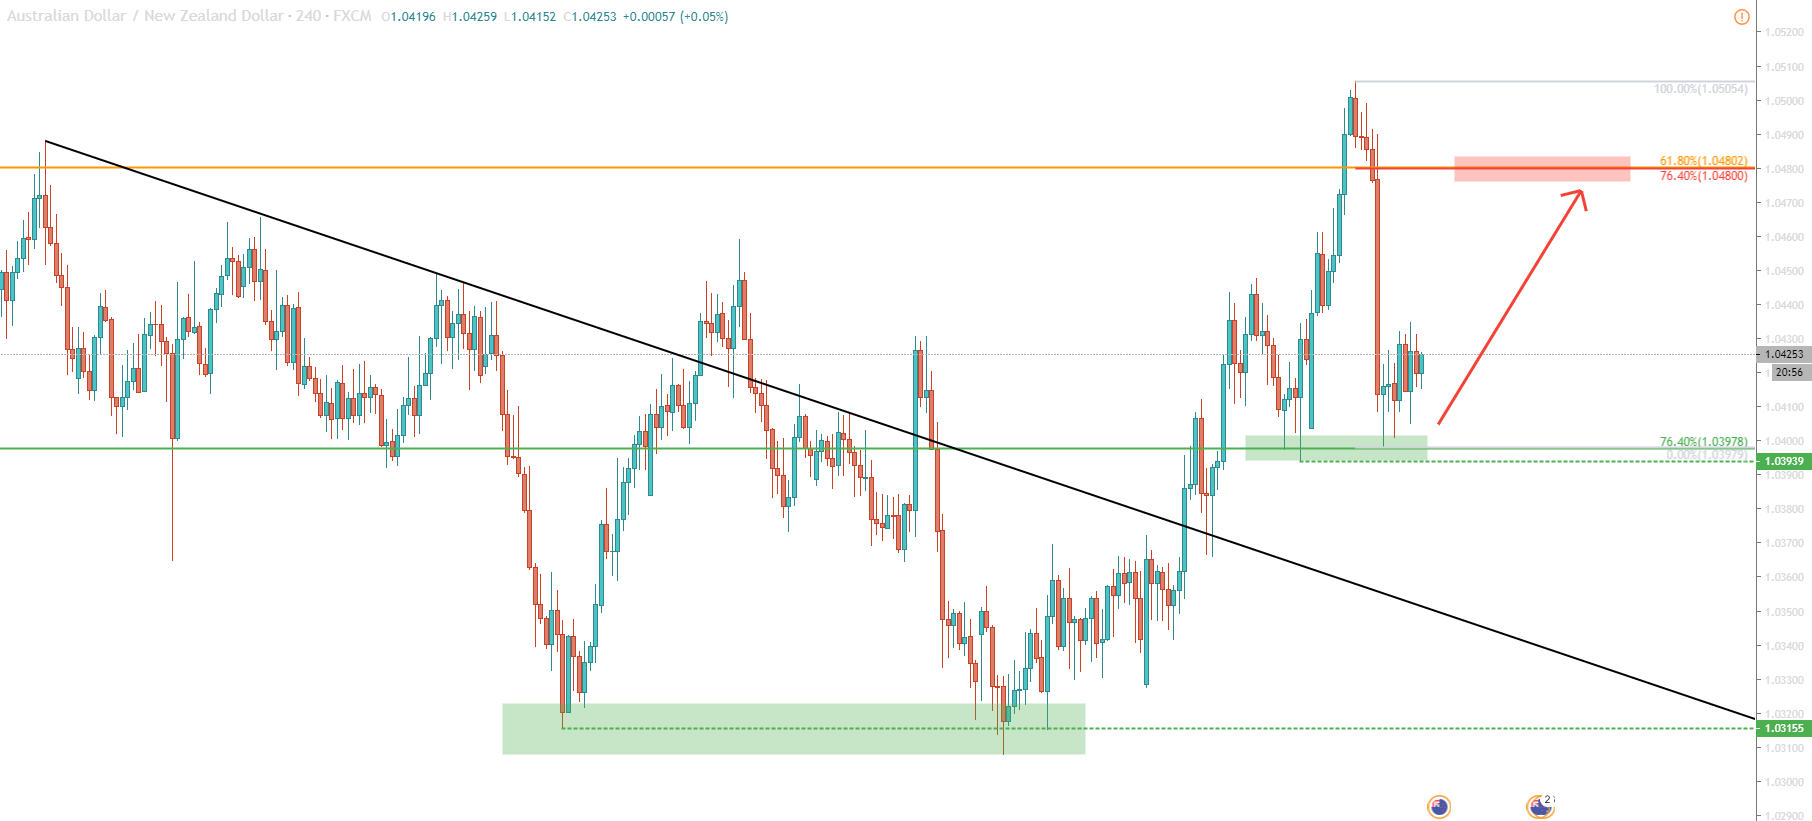
1.0397 mark corresponds to the 76.4% Fibonacci retracement level, which has been rejected cleanly on February 12. It is also interesting to see what has happened prior to that. Back on January 27, AUD/NZD formed a double bottom near 1.0315 while rejecting this area for the second time.
A double bottom confirmation has initiated a bull run, resulting in a break above the downtrend trendline, after which price has reached 1.0505 high on February 11. During past few days, AUD/NZD has corrected sharply, losing 107 pips (1.02%). Price has formed a double bottom near 1.0400, which is not only a technical, but also a strong psychological support. As long as price remains above 1.0393, uptrend continuation should be expected.
The 1H chart is also worth looking at. Clearly price producing higher highs and higher lows while respecting the uptrend trendline.
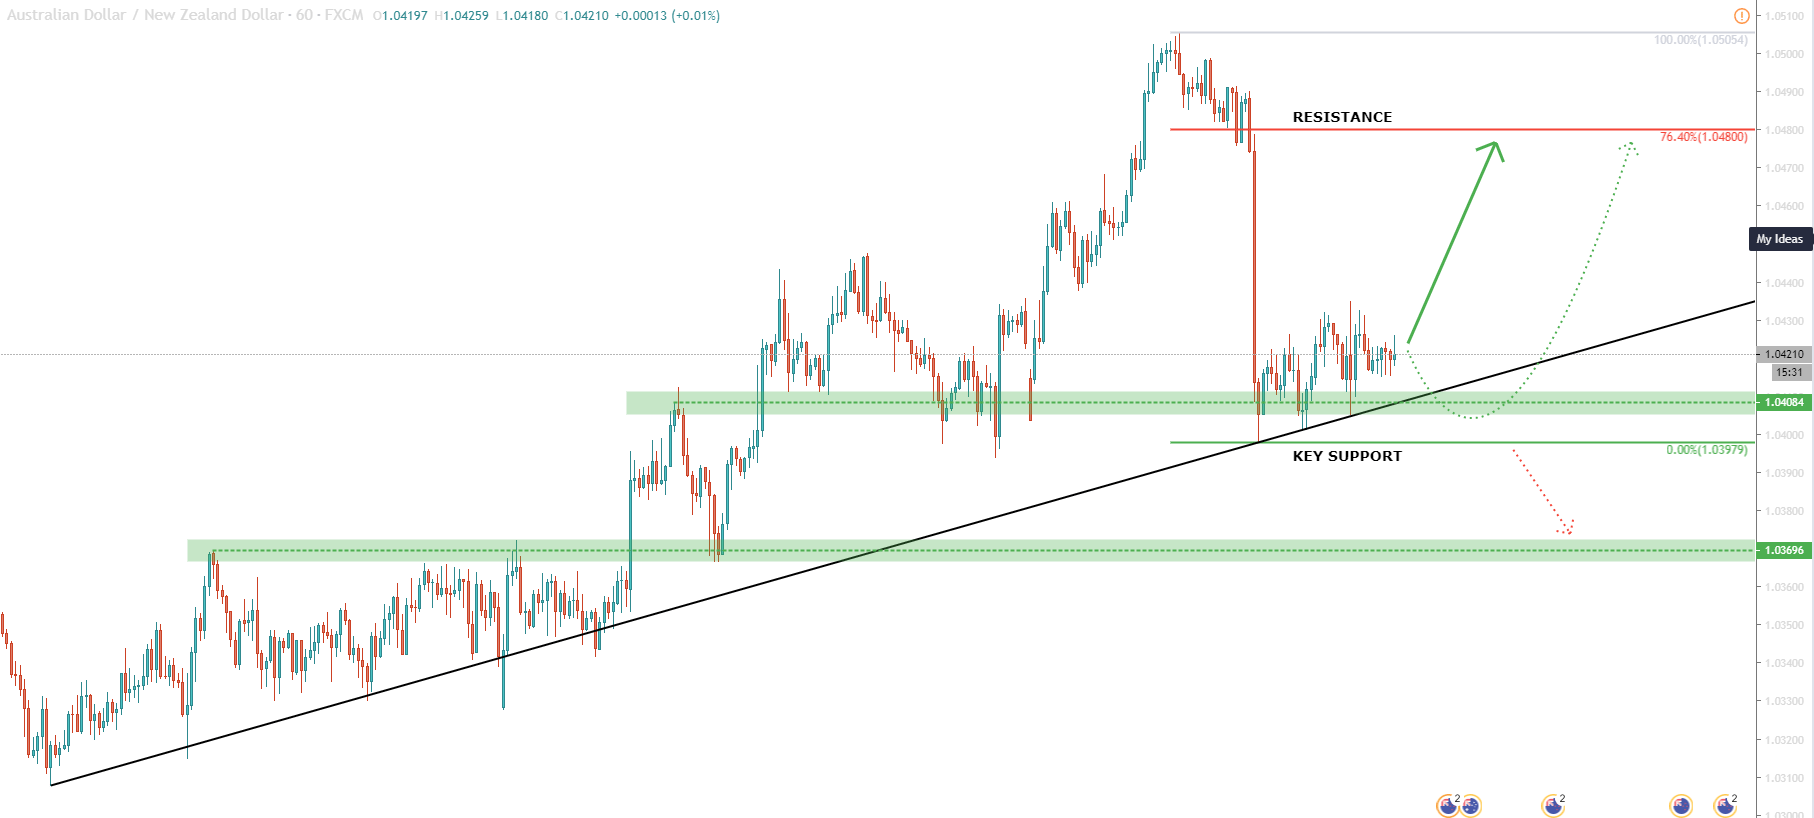
Based on previous levels of resistance, we can locate two strong support areas that were formed during a currently ongoing uptrend. These areas are 1.0370 and 1.0408. As long as the nearest support holds bulls will continue to dominate. However, before the next wave up will start, the price might consolidate for a little longer.
All-in-all bullish scenario probability is very high, but there is always a risk. Stop-loss hunting can take place, where AUD/NZD would decline below 1.0405 for a short period of time. This would most likely look like a price spike, after which uptrend should resume.
Lastly, we will take a look at the 15M chart. After 1.0397 Fibonacci support was rejected, AUD/NZD currency pair started to move up, printing higher highs and higher lows. The uptrend trendline was rejected today, suggesting more upside potential.
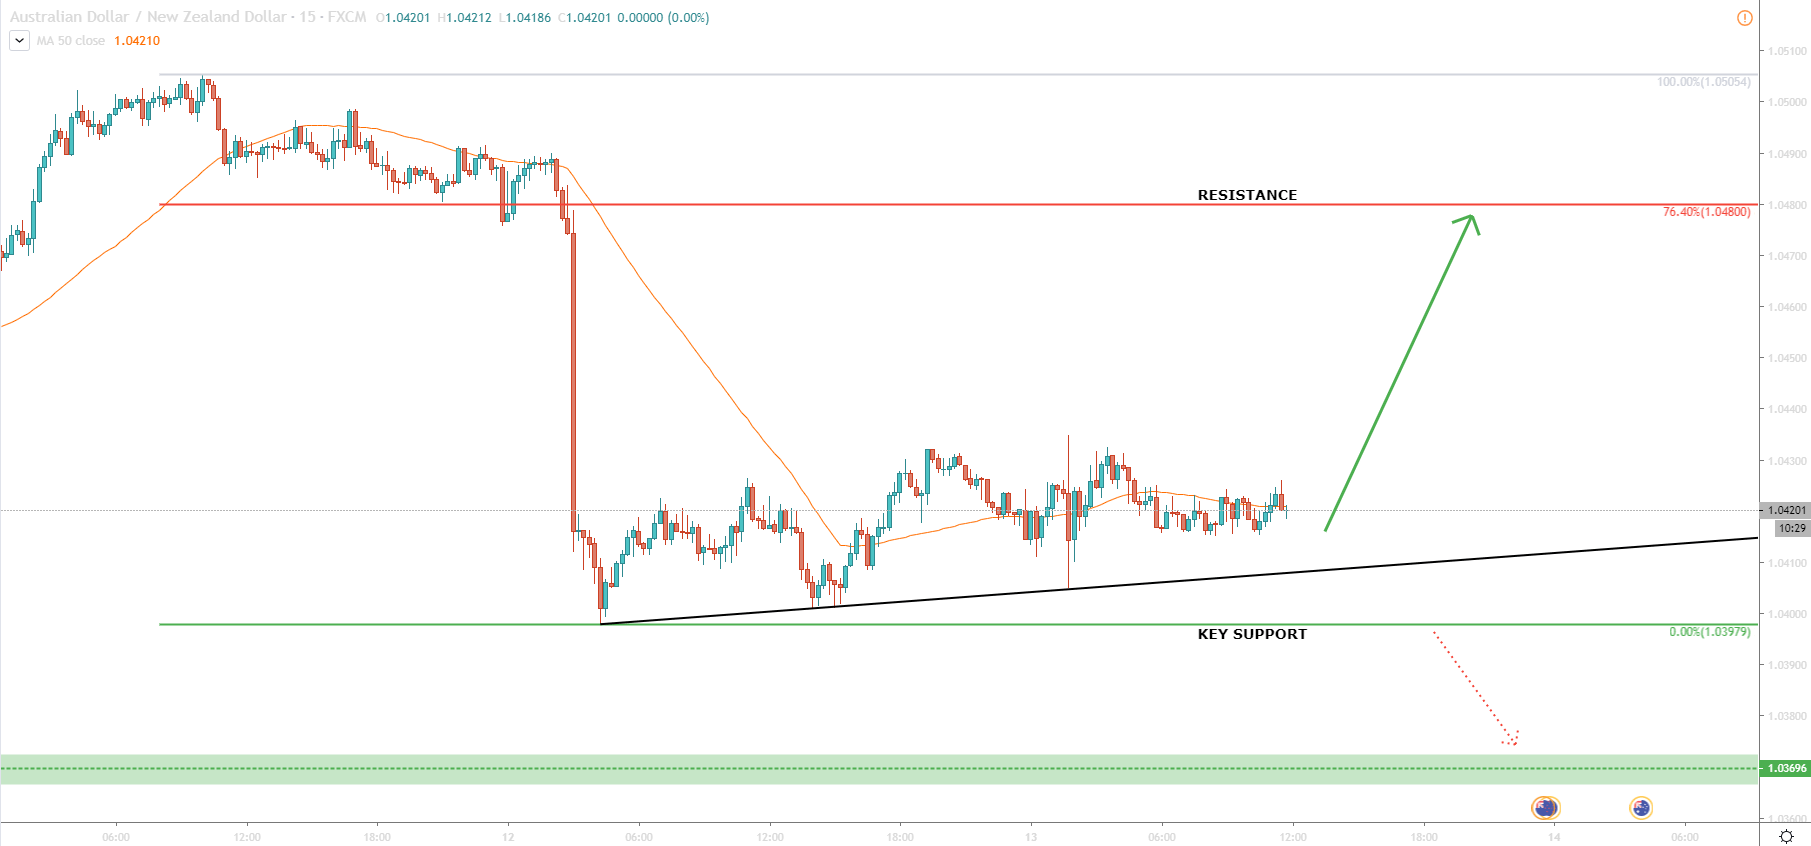
The uptrend remains valid with the high probability of continuation. AUD/NZD might not produce a new higher high, but at the very least we expect another short-term wave up.
1.0480 is strong resistance and a good profit-taking level as it corresponds to 2 Fibonacci retracement levels at the same time.
The bullish sentiment would be destroyed only after the break below 1.0397. In this case, the upside scenario would be invalidated and the price can easily drop further down. Alternatively, the consolidation phase would be initiated.
Support: 1.0393, 1.0369
Resistance: 1.0480, 1.0505