
Published: June 5th, 2020
Most AUD pairs had experienced an astonishing rally during past few months in general and during this week in particular. But as we know, what goes up, eventually must go down. At this stage, we might be witnessing the beginning of a correctional move down, which is expected to be very sharp. But at the same time, it could be the beginning of a long term downtrend continuation, which is yet to be seen or confirmed. All-in-all, the trend is heavily bullish and the price is strongly overbought. Usually, this is the case for a heavy correction.
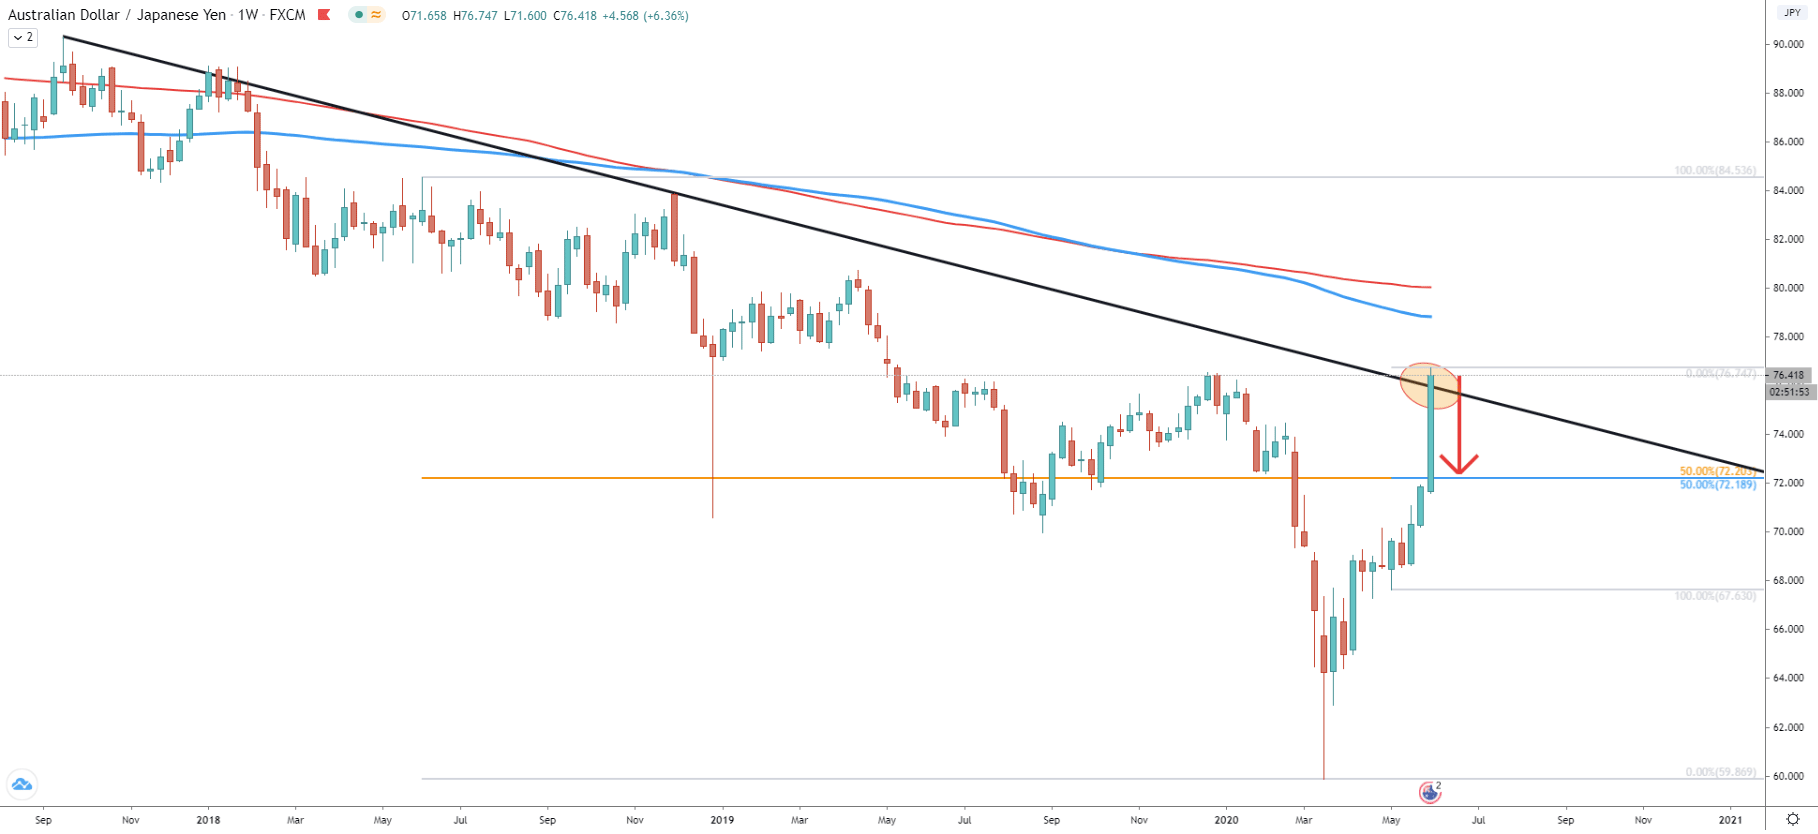
On the weekly chart, we can witness a long term downtrend wich remains to be valid as no higher high has been produced. At the same time, today’s price has reached the long term downtrend trendline which is likely to be rejected. Moreover, price remains below both 200 period Moving Averages, Simple and Exponential, confirming the validity of the downtrend. You can see two Fibonacci indicators applied to this chart. First applied to the overall downtrend after breaking the 200 EMA and SMA. The second is applied to the last wave up. Both of them at 50% retracement and are pointing out to one level, which is 72.20. This is likely to be the key support area in the medium to long term, and obviously a perfect profit-taking area for those who are considering to sell AUD/JPY.
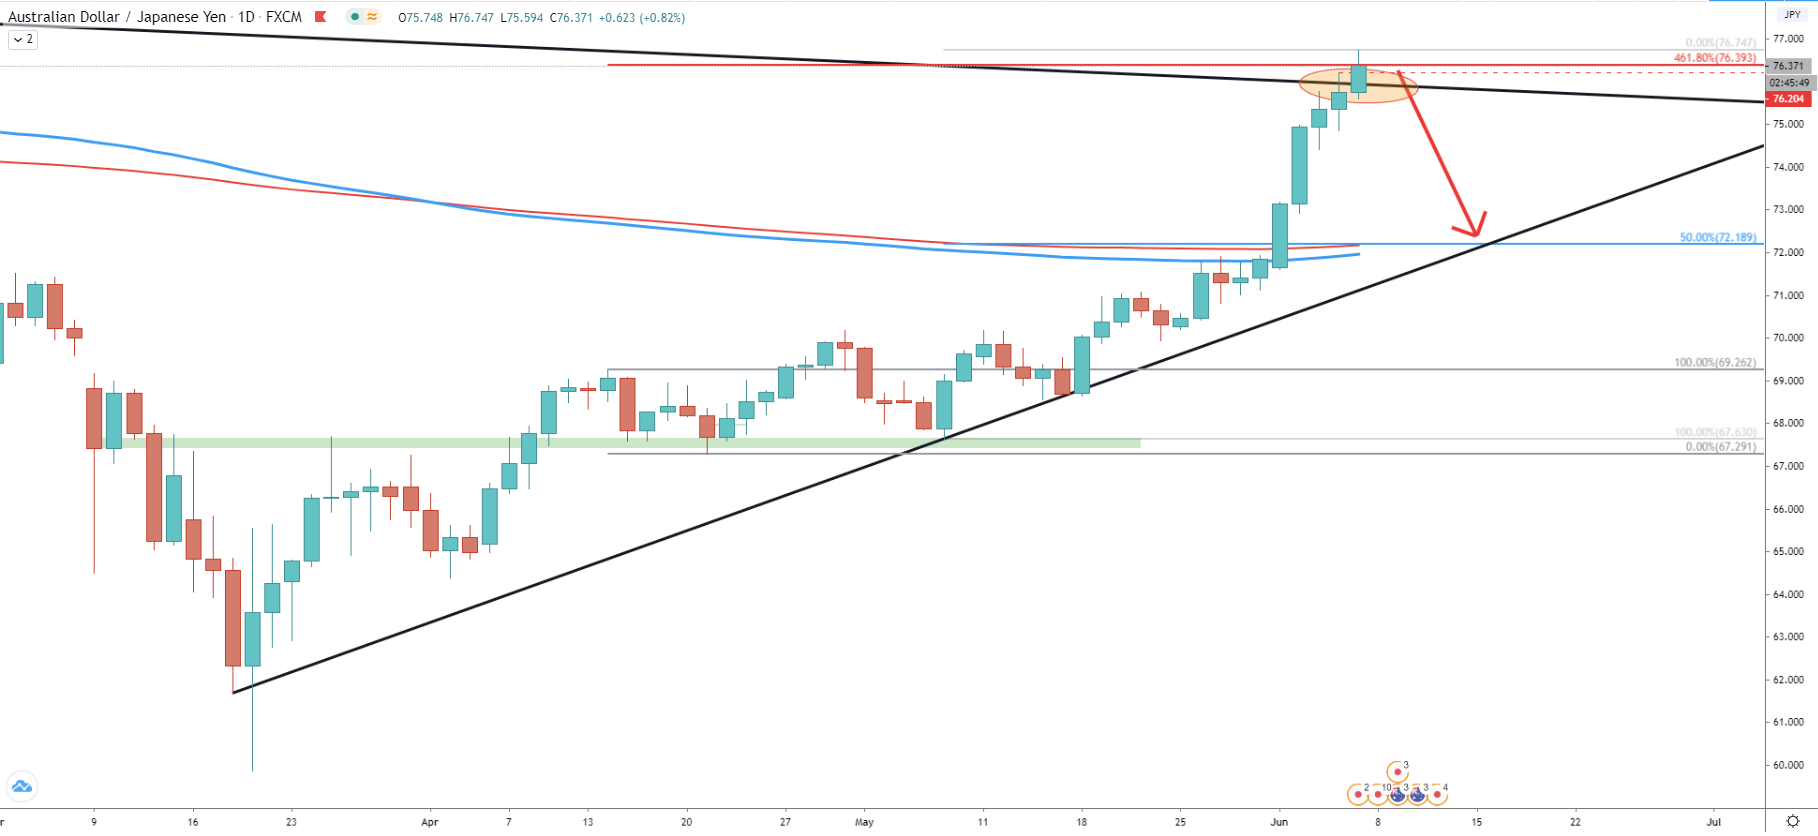
On the daily chart, we can see how the uptrend trendline, of the overall move up, has been rejected. There was a resistance formed near 67.60, which eventually got broken and then price found the support in this area. Fibonacci applied to the corrective wave down after breaking the resistance, shows that 461.8% Fibs is currently acting as the resistance. Along with it, the downtrend trendline is being rejected and there is still no daily close above it. It would be extremely important to watch the Weekly closing price as if it will get below 76.20, the correctional move to the downside should be confirmed.
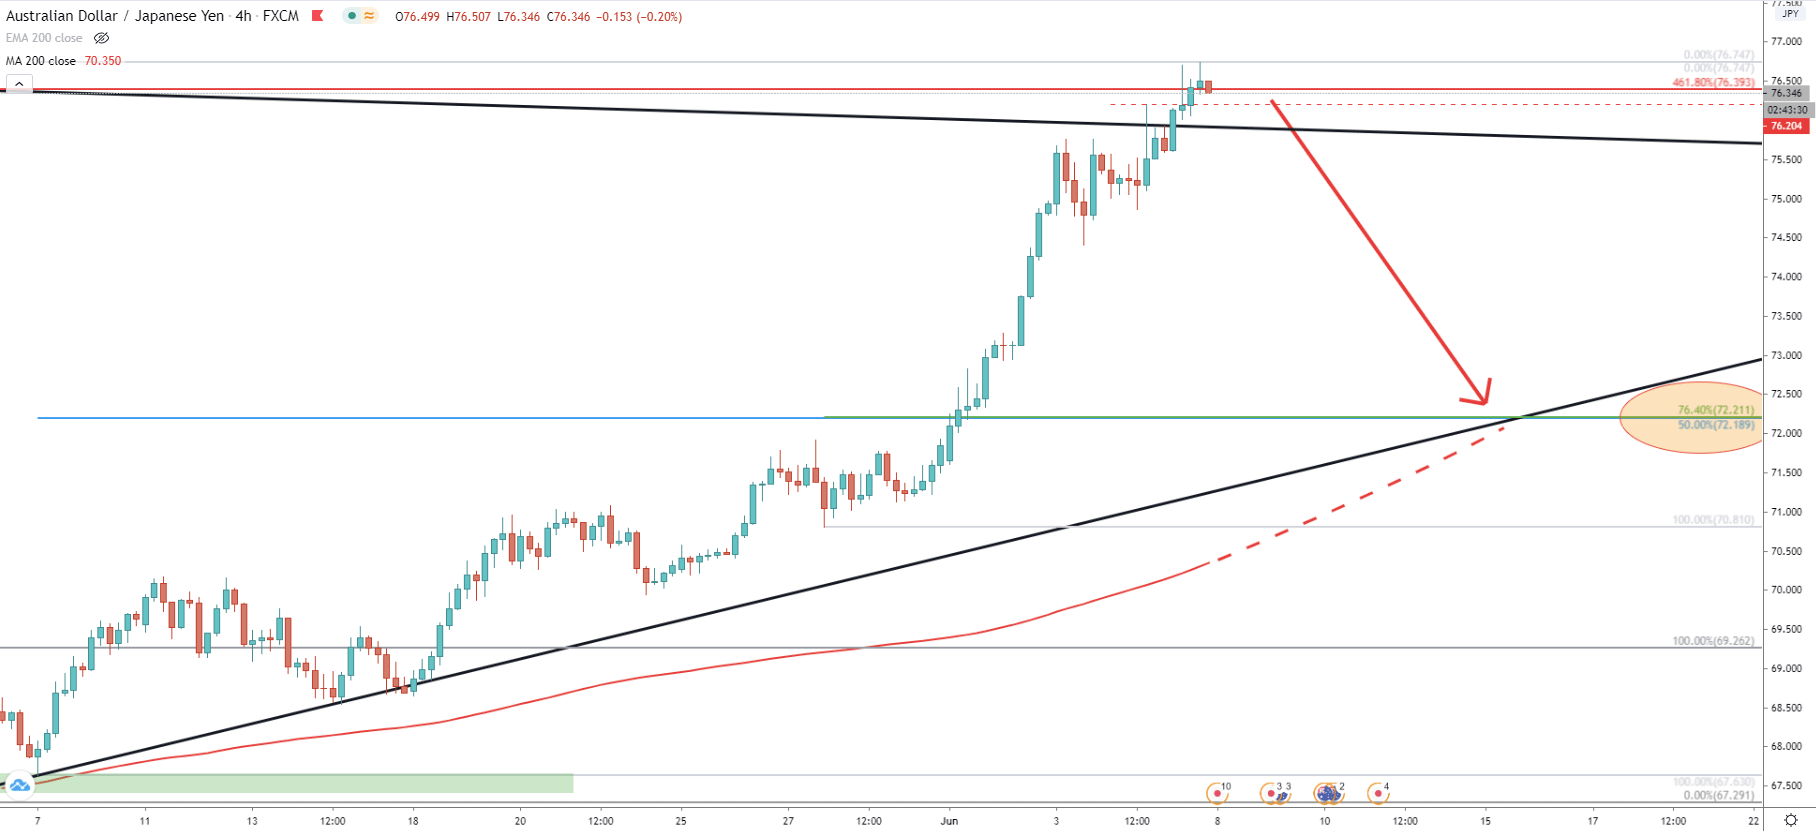
On the 4-hour chart, we can also see that the long term downtrend trendline, as well as 461.8% Fibonacci retracement level, are still being respected, which is a very bearish sign. On this chart, you can see two Fibonacci indicators, one as per the daily chart and the second applied to the most recent wave to the upside. These are 76.4 and 50% retracement levels, both of them, once again correspond to the 72.20 support level as well as the uptrend trendline and the 200 Exponential Moving Average. And yet again it makes this level the most interesting price for the sellers as well as buyers, should the price reach it.
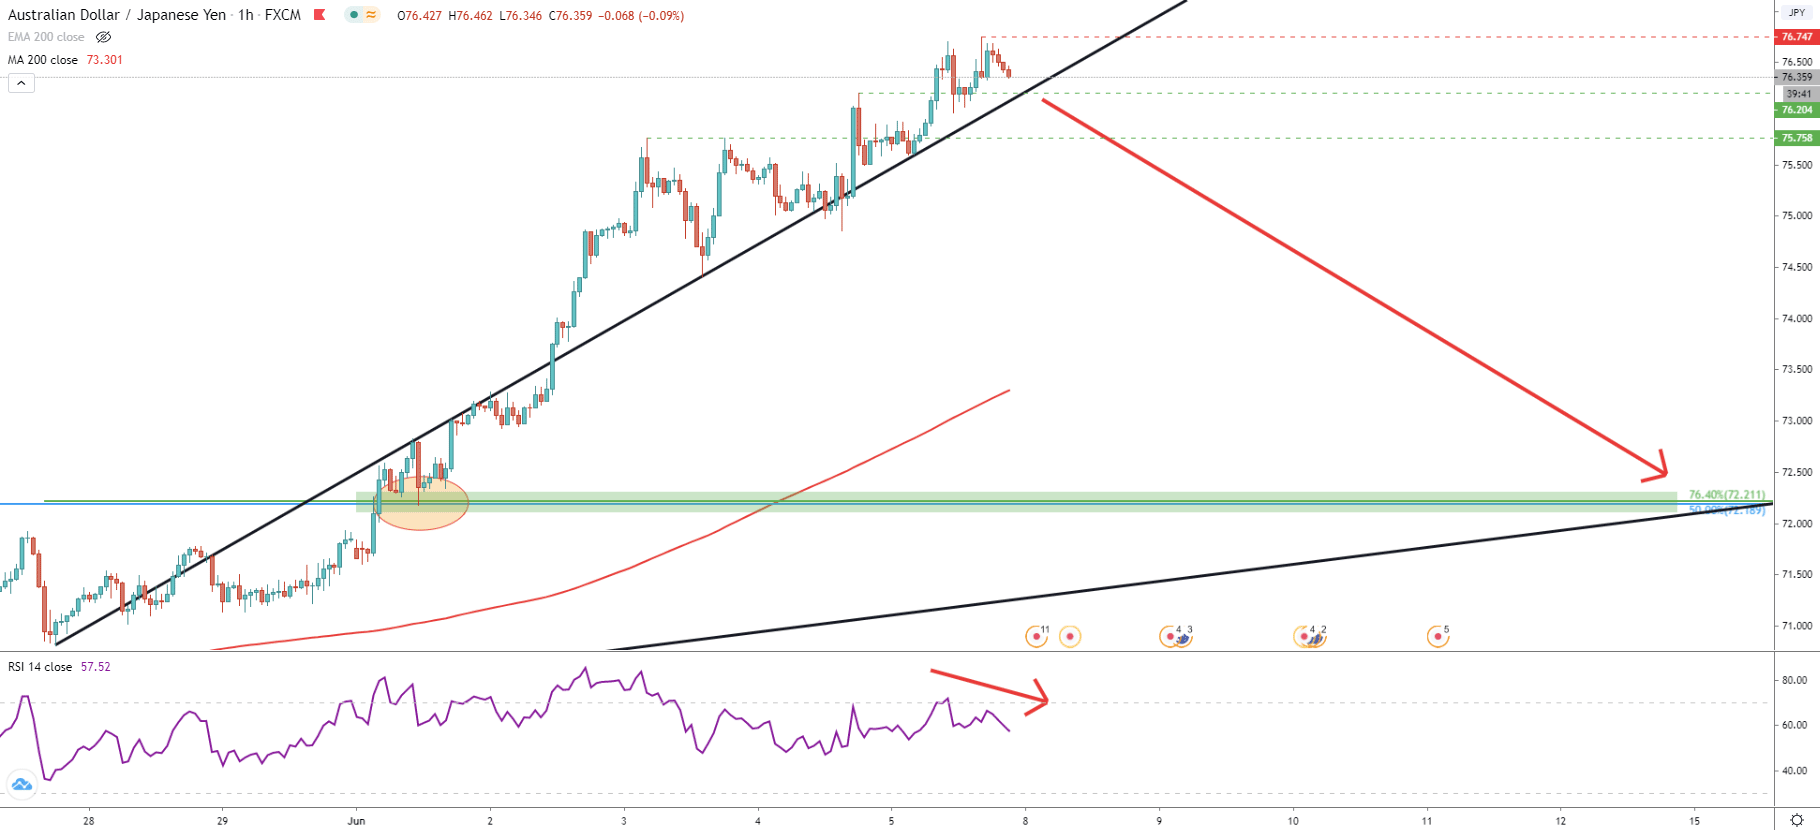
Finally comes the 1-hour chart, where price remains above the average price trendline. But what is important, is the formation of the bearish divergence on the RSI oscillator, which shows the potential beginning of a strong corrective wave to the downside. However, there are minor support levels formed previously, namely 76.20 and 75.75. Perhaps it is best to wait until both of them are broken on the 1H timeframe, which should be considered as a final confirmation of the incoming downside correction.
The strong rally on the AUD/JPY could have exhausted itself after reaching the long term downtrend trendline. Perhaps now it is the time for a sharp pullback, which might send price down by 400 pips.
As per multiple charts in this analysis, the main downside targets, corresponding to 3 different Fibonacci retracement levels, the uptrend trendline, and the EMA, is seen at 72.20 area.
The highest high has been produced at 76.75, which is now a key resistance level. If price manages to break and close above this price on the 1-hour chart, the correction to the downside will become much less relevant and the price is likely to produce further spikes to the upside.
Support: 76.20, 75.75, 72.20
Resistance: 76.75