
Published: March 26th, 2020
Following our previous analysis on AUD/CHF (March 24th, 2020), pair broke above the key resistance area, which confirmed bearish sentiment. But let’s divide deeper into the current price action.
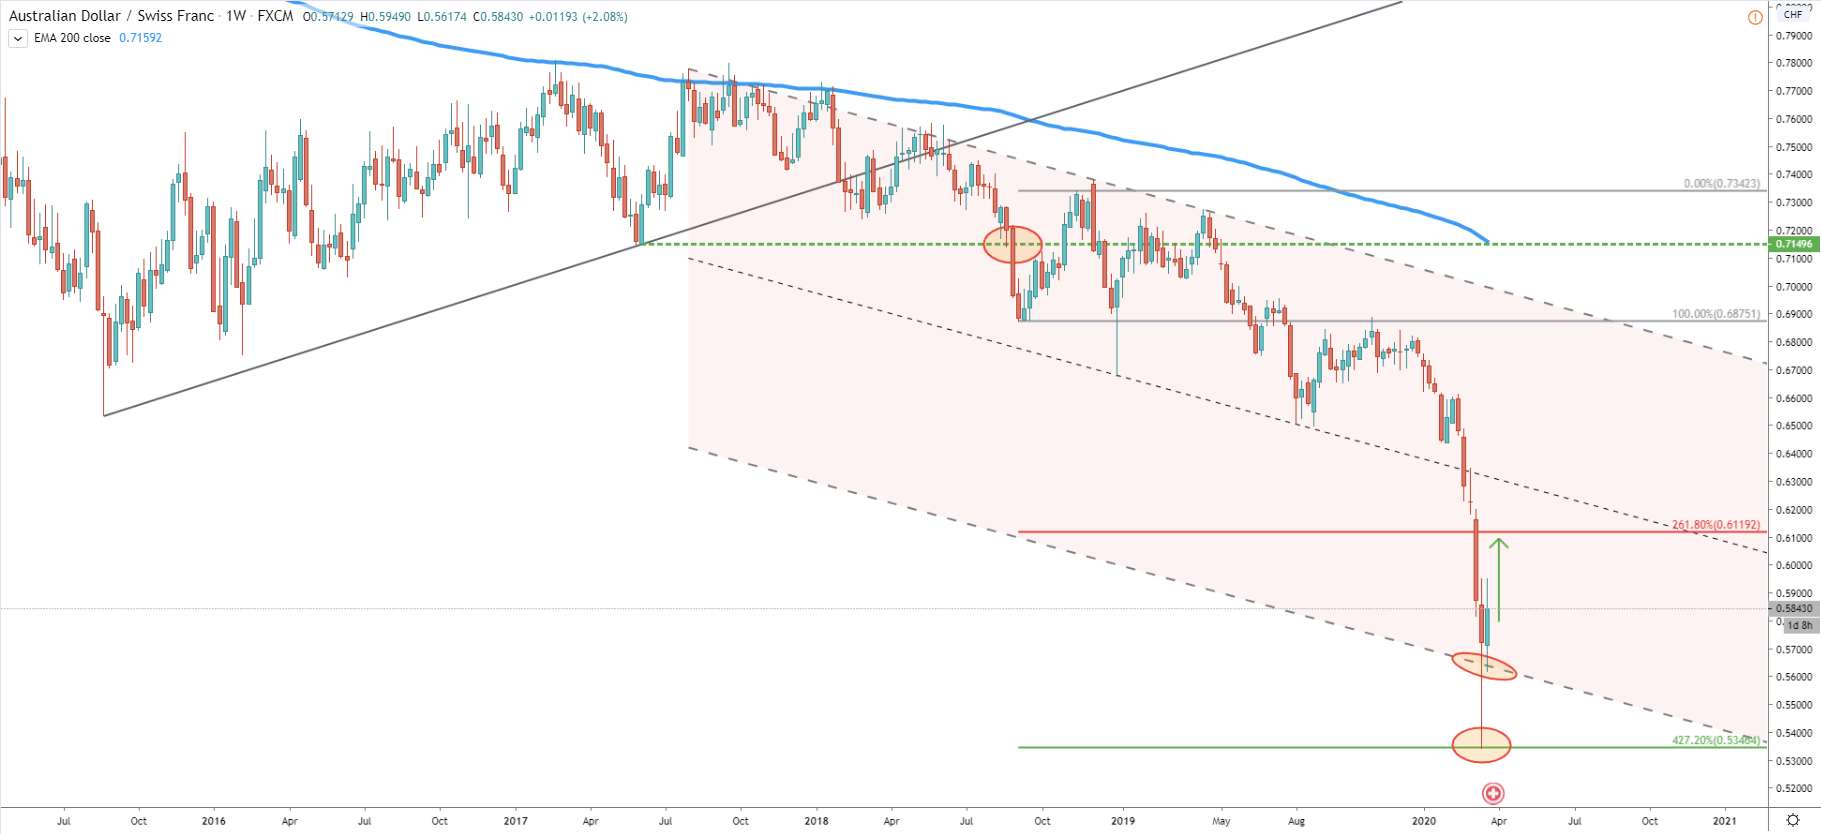
Starting with a Weekly chart, we can see that AUD/CHF cleanly rejected 427.2% Fibonacci support level at 0.5348, which was the bottom formed on March 19. Since then, the price went up by nearly 10% and currently is trading at 0.5855 area. We can also see that AUD/CHF reached the bottom of the extended descending channel, and price failed to close lower. Overall it seems the correction to the upside will be extended further.
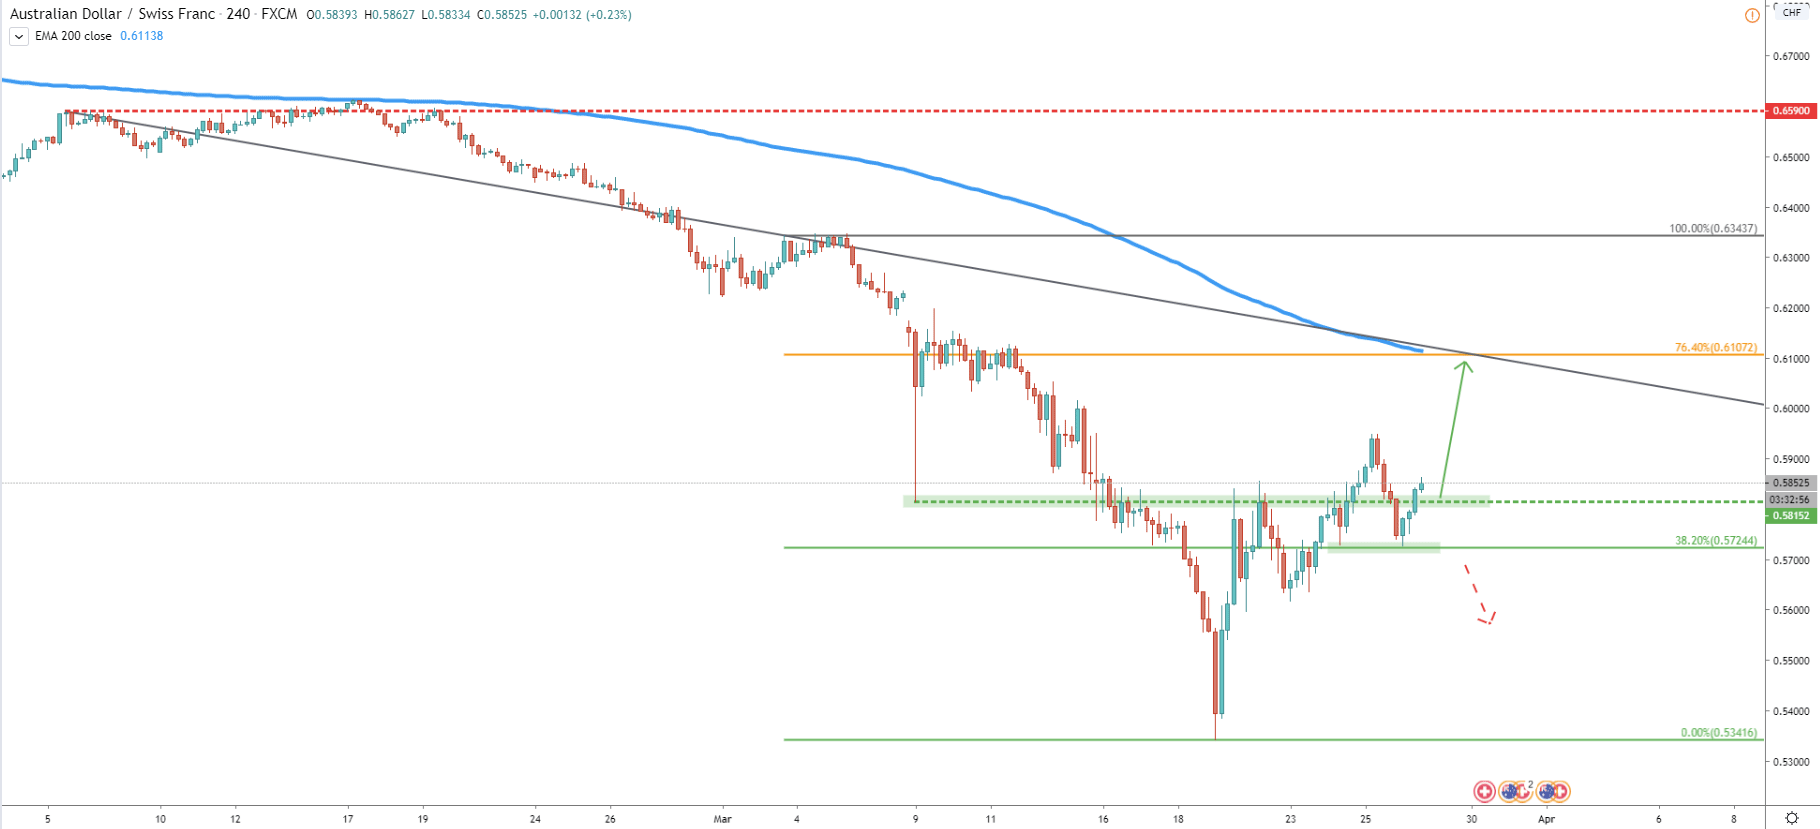
The 4h chart shows that recently CAD/CHF rejected a 38.2% Fibonacci retracement level at 0.5725. Moreover, the price has formed a double bottom there and currently is printing higher highs and higher lows. The nearest support is seen at 0.5815, where the price might get back. This might be a very strong demand price and should be very attractive for buyers. Price might starts rising towards 200 Exponential Moving Average, which corresponds to the 76.4% Fibonacci retracement level at 0.6107.
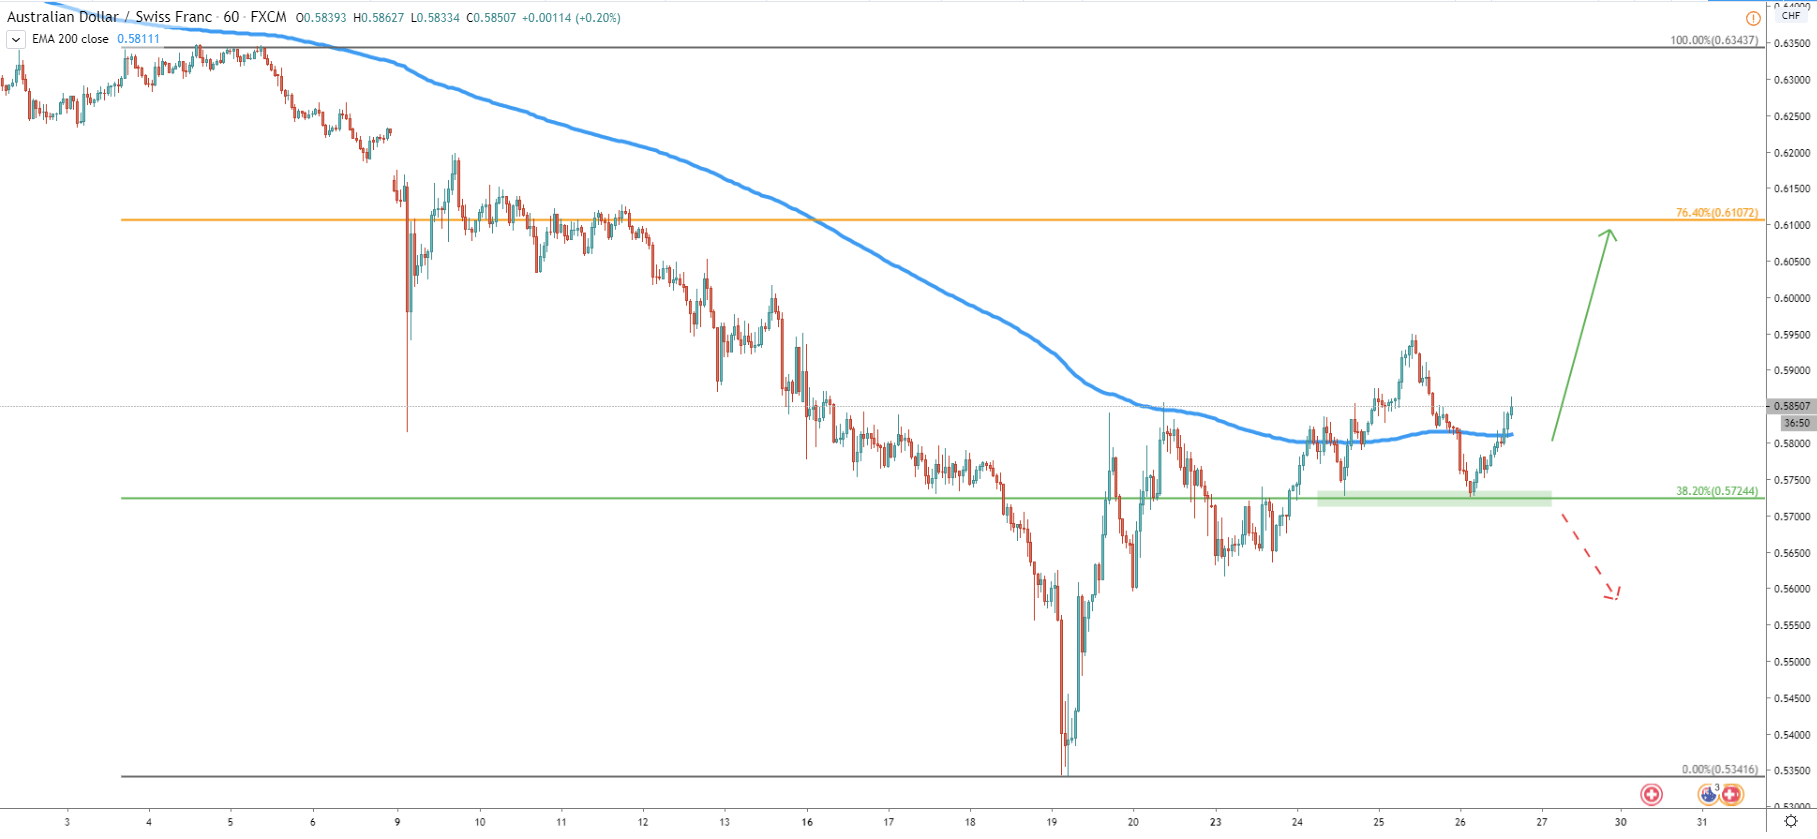
The key support level now based at 0.5725, where AUD/CHF formed a double bottom. After this, it broke above the 200 EMA on 1h chart and seems ready to produce a new higher high. But if the support is broken, this forecast will be invalidated, and price yet again could decline towards the previous lower low, near 0.5340 area.
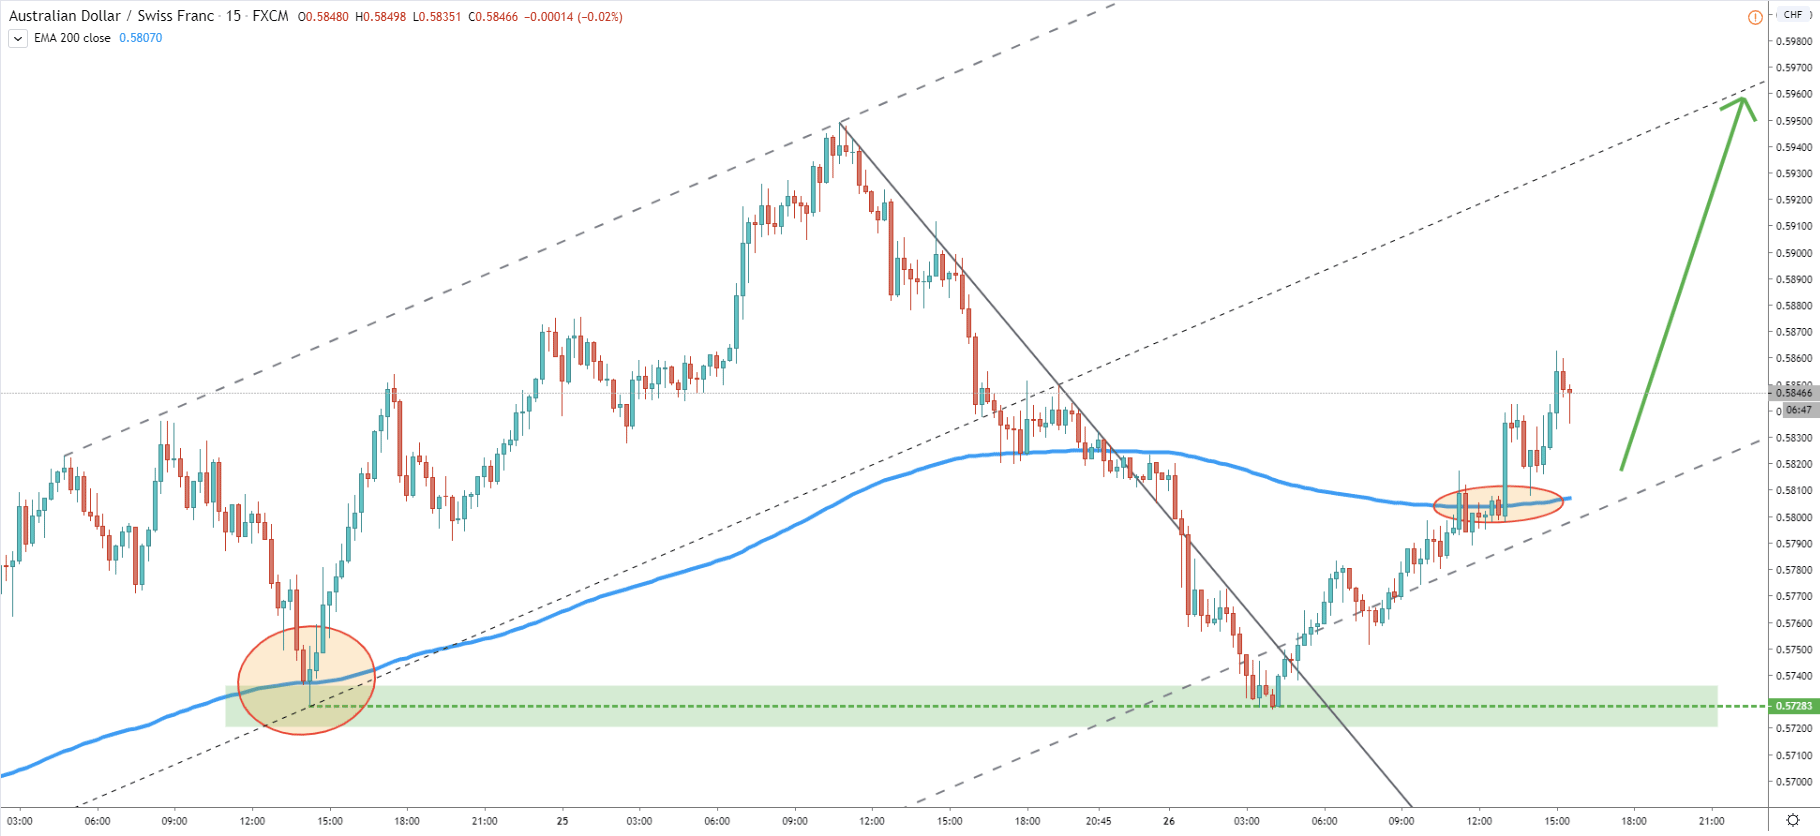
On the 15m chart, the support level at 0.5728 is more clear. This is the price level where AUD/CHF rejected the 200 EMA on March 24. Todays’ bottom was right at the same support level and was respected by the market. Pair reached the bottom of the extended ascending channel, then broke above the downtrend trendline and the 200 EMA. It shows price strength and potential change in sentiment, from bearish to bullish.
The price action was very unclear, up until the point where AUD/CHF produced a new higher high on March 25. It confirmed the potential bullish scenario and gave time to find a good buying opportunity. Today, we could have witnessed, that the buying opportunity was in fact very attractive after price rejected the support and started to move higher. Overall, the trend could be changing or at the very least there will be a strong correction to the upside.
The key resistance is seen at 0.6107, which is 76.4% Fibonacci retracement level. It also goes in line with a 200 EMA on a 4h chart. If this level is broken, and daily candle breaks and closes above, it could be the confirmation of the beginning of a long term uptrend.
In the long run, the trend remains bearish and currently, we are just experiencing a corrective wave to the upside. It might not be that strong and price cant continues moving down at any point. But only daily break and close below 0.5724 would invalidate bullish outlook and will result in a long term downtrend continuation.
Support: 0.5815, 0.5724
Resistance: 0.5950, 0.6107