
Published: March 24th, 2020
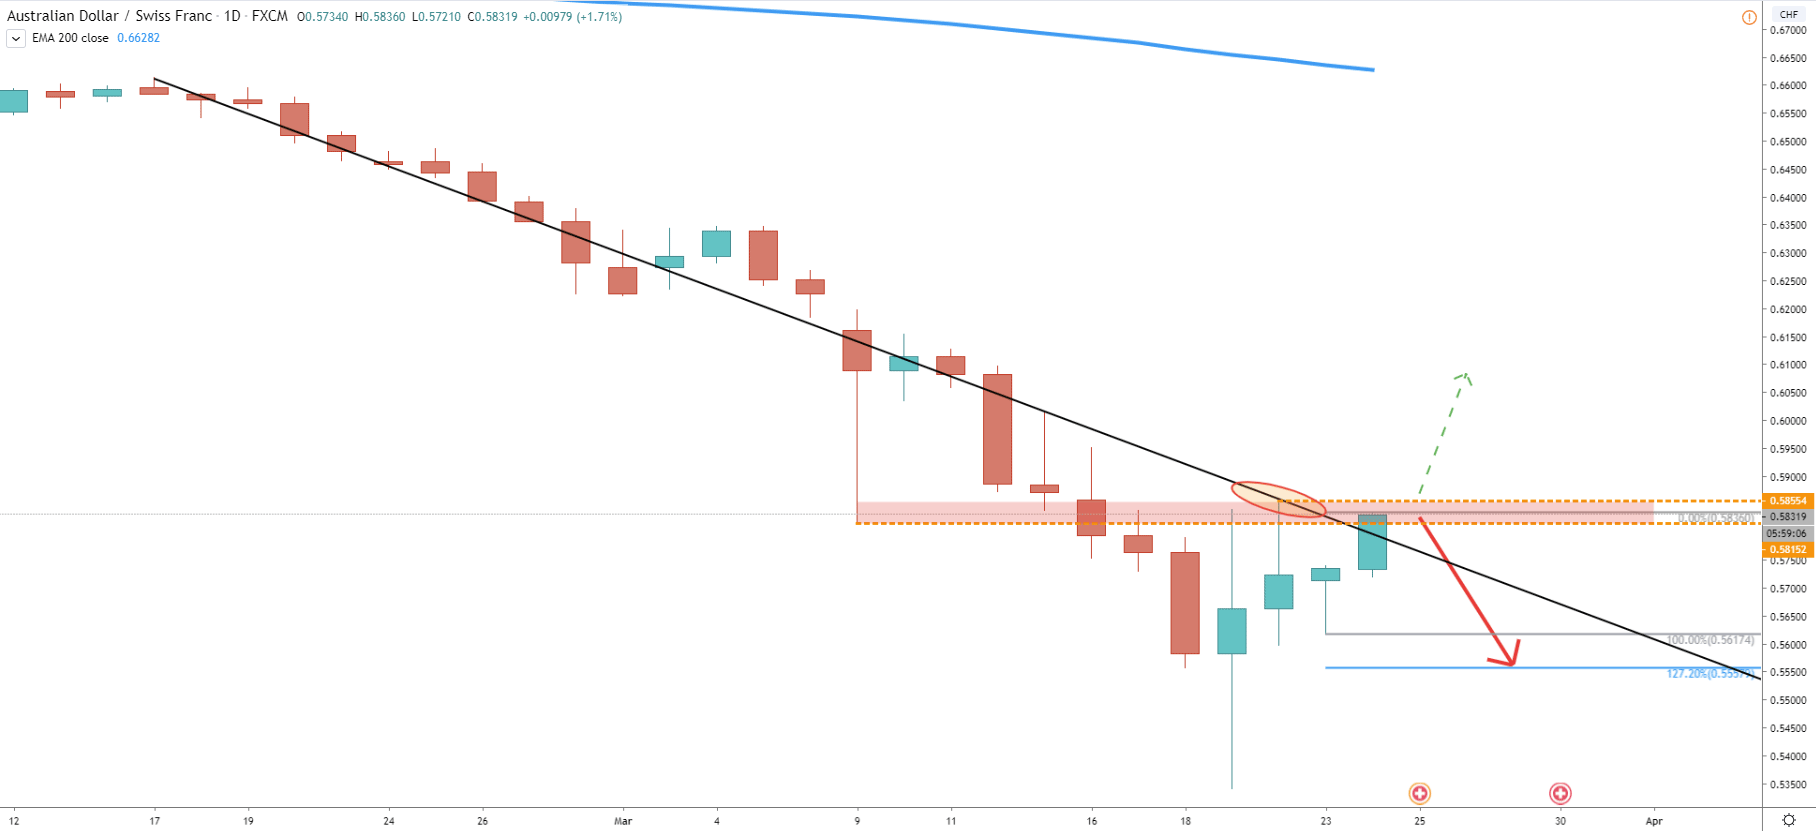
If we look at the daily chart, the last wave down has resulted in a nearly 20% drop, which is 1272 pips. These numbers are huge for the AUD/CHF and indeed the downtrend was very strong. Price has found the bottom at 0.5341, where a large spike has been formed. Potentially, this might be the signal of a trend reversal, although if we look at previous spike occurred on March 9, the downtrend simply continues. Therefore, we can expect a similar scenario, where the price will continue moving down. But this time it is yet to be seen whether the previous low will be broken.
Currently, AUD/CHF is right at the resistance zone, which is between 0.5830 - 0.5855, where previous support was formed. At the same time, the downtrend trendline has been rejected cleanly. It is possible that the pair will produce a spike above 0.5855, although only daily break and close this price can confirm trend reversal. While the resistance is holding, we can expect yet another wave to the downside.
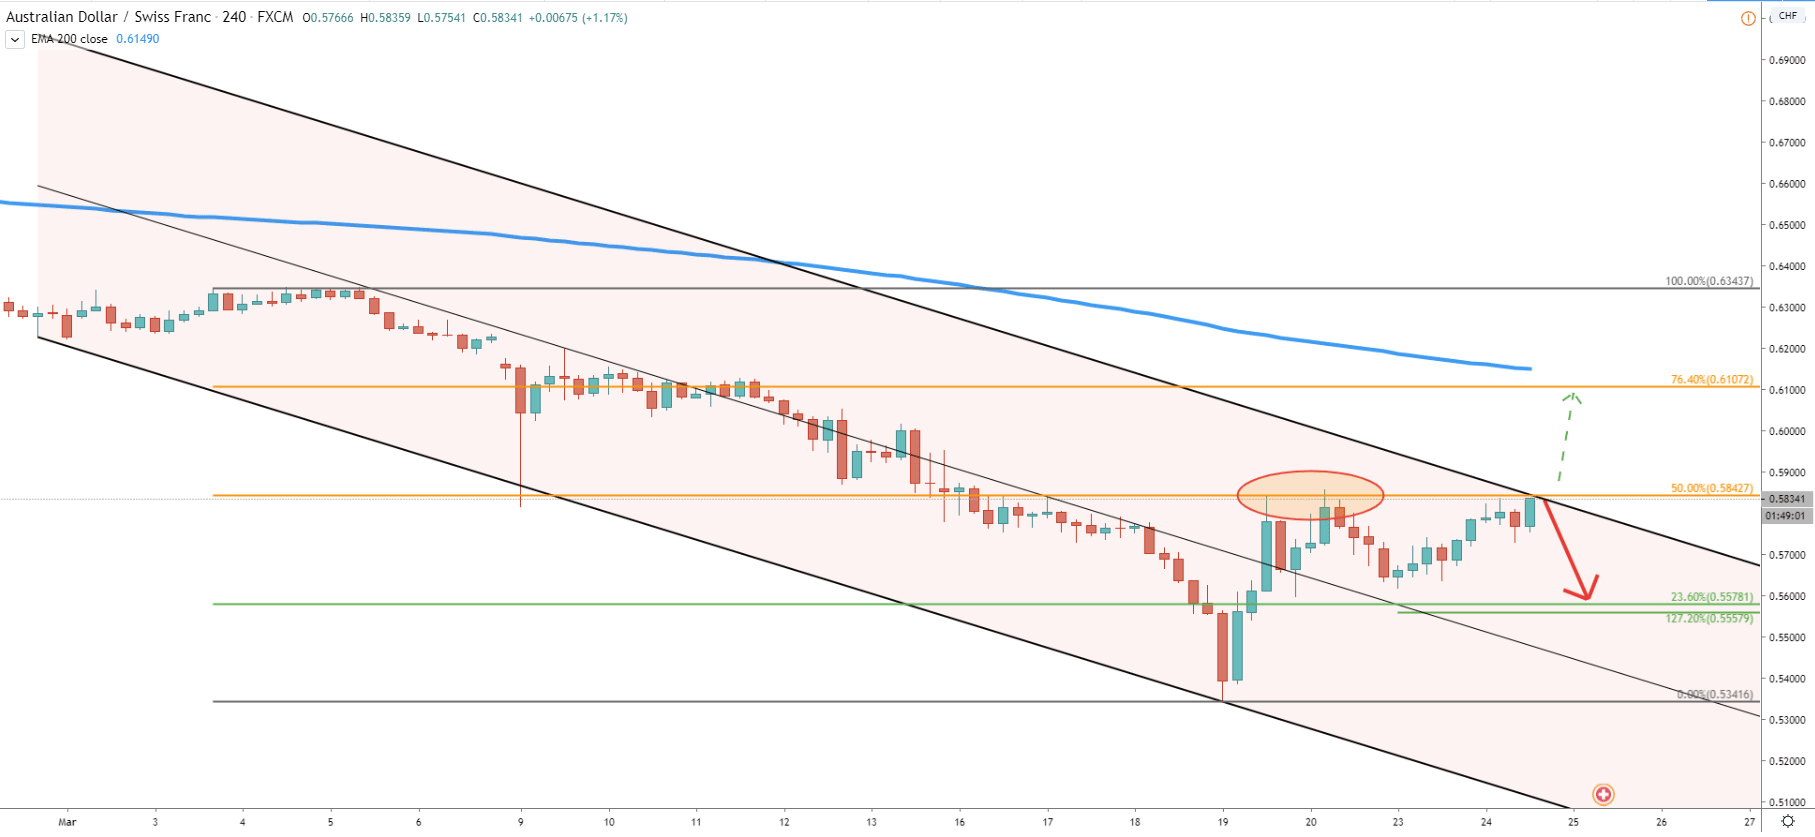
On 4h chart price has reached the top of the descending channel which could act as the resistance throughout the next 24 hours. It will be important to see if the price managed to close above either on 4h and/or Daily timeframe.
Also, there was a clean bounce off the 50% Fibonacci retracement level after which price attempted to break above, although it failed to close higher. Currently, AUD/CHF is trading at the very same resistance area, which could be a very attractive selling zone.
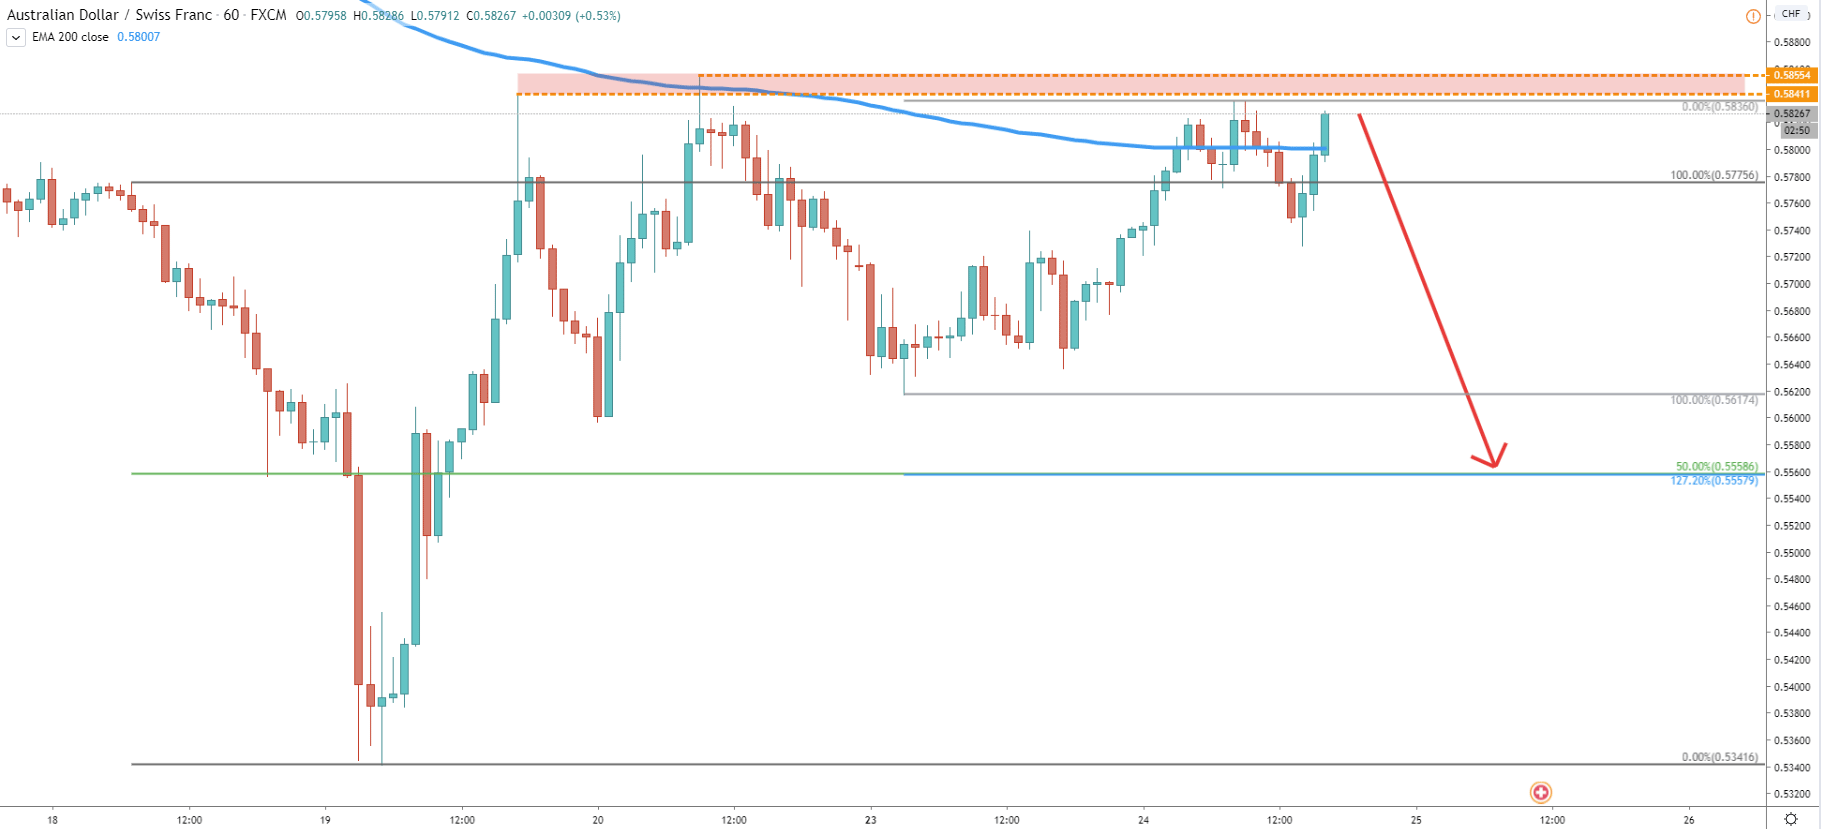
The chart on the 1h timeframe shows that the pair rejected the 200 Exponential Moving Average. Now it is obvious that 0.8550 is a key resistance area. At the same time, it is a strong supply zone in the short term. If a daily candle will not be able to close above 0.5855, a pullback down should occur. Very strong support is seen at 0.5560 area, which is confirmed by two Fibonacci retracement levels. First is 50% Fibs, applied to the last wave down, where pair formed the recent bottom Second is 127.2% Fibs applied to the current corrective wave up. Both of them stand at the very same price, which is 0.5558.
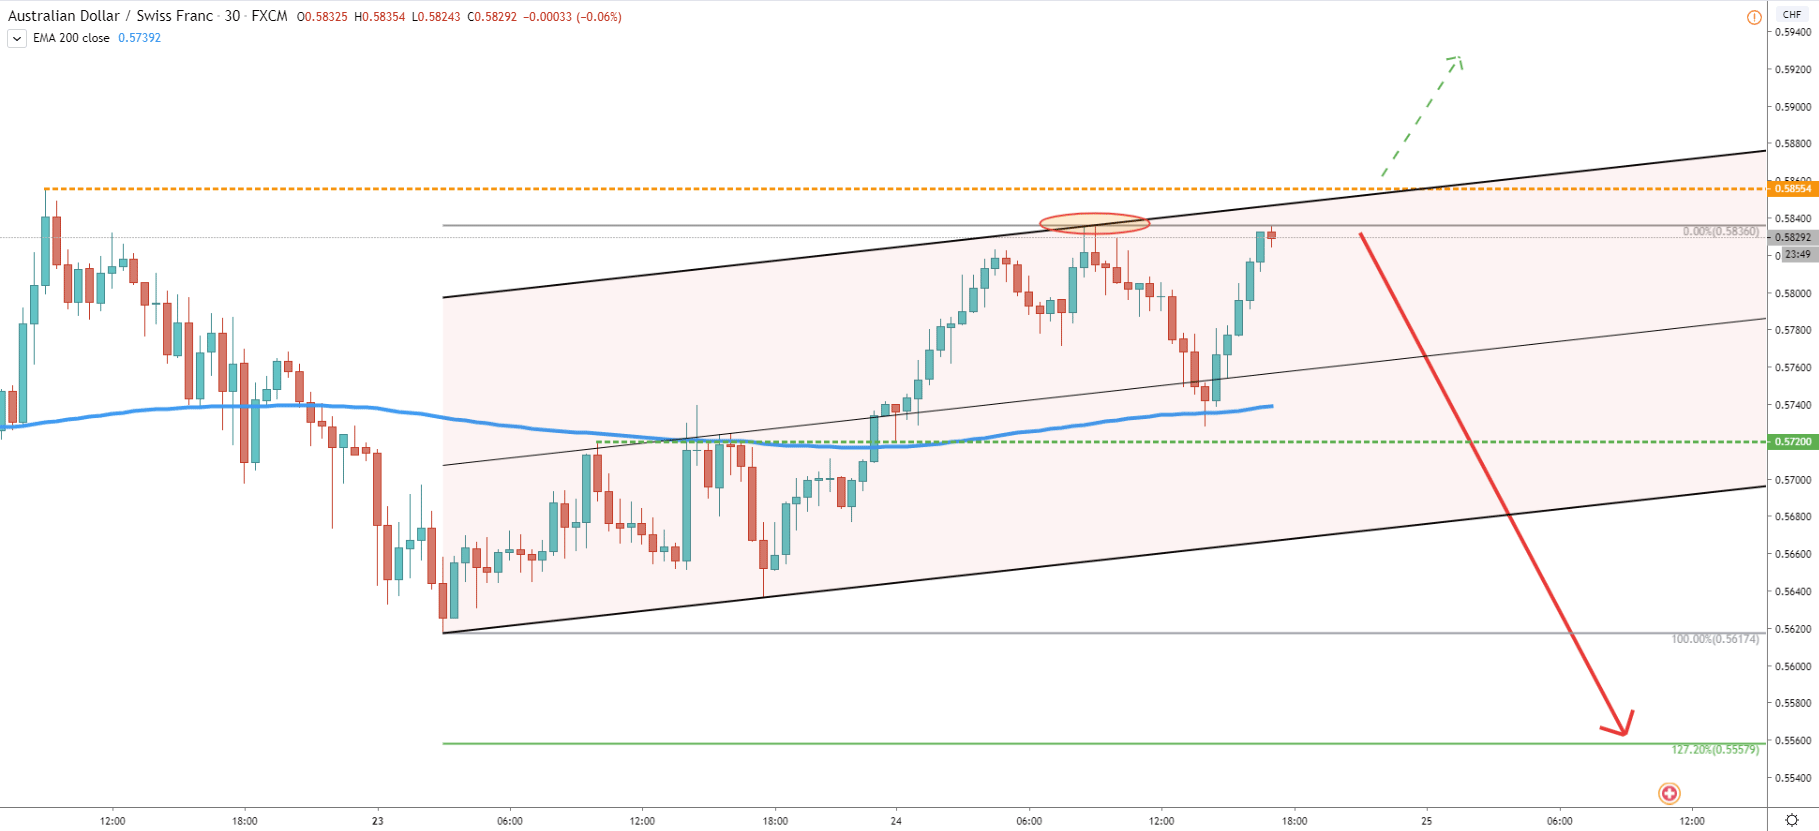
Finally, we will look at the 30m chart, where the price has reached to top of the extended ascending channel. The upper trendline was rejected and overall we can see that 0.5850 are is strong resistance on multiple timeframes. Spikes higher can be expected, but as already mentioned, only 4h and/or a daily close above the 0.5855 would invalidate bearish scenario.
Long term downtrend remains bearish and recent correction could be used by traders to go short once again. This is because the price has reached a very strong resistance area, which up until now is being respected by the market.
0.5558
Uptrend probability remains very low as long as the resistance holds. But break and close above 0.5855 would immediately invalidate bearish scenario and could in fact result in a trend reversal. At the very least it should be a strong correction to the upside.
Support: 0.5720, 0.5617, 0.5558
Resistance: 0.5836, 0.8555