
Published: October 15th, 2020
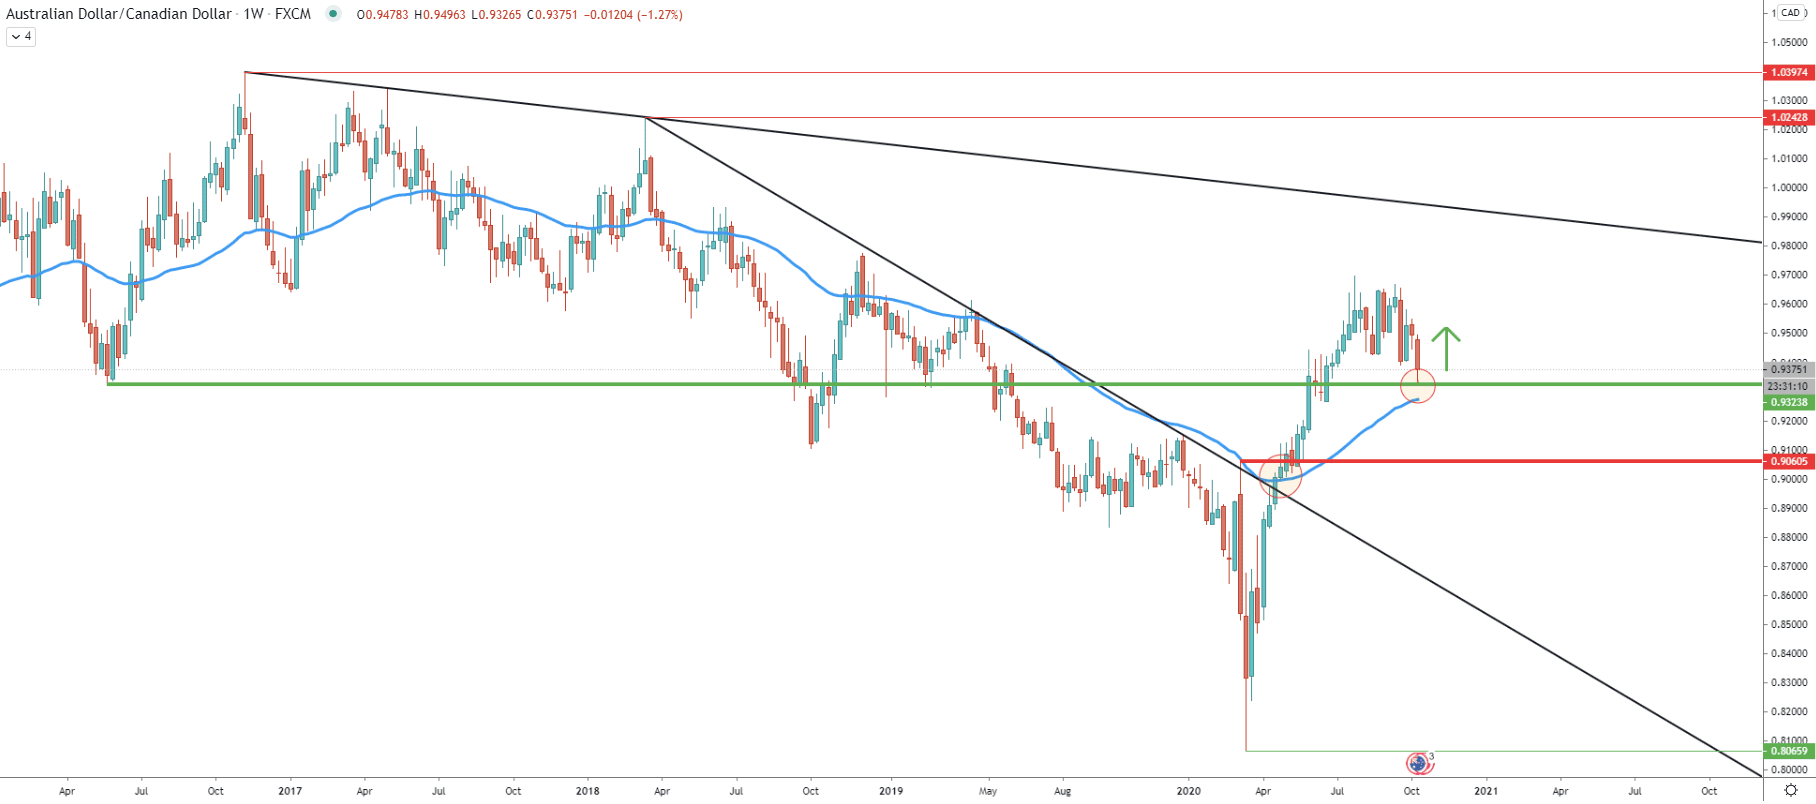
Back in March this year, AUD/CAD bottomed out while hitting a 0.8065 low. Since then the price has been on a steady rise, in fact, the recovery has been very fast. Pair already broke above the downtrend timeline as well as 50 Exponential moving average at the same time. The price tested 0.9696 high and corrected down to the long term support level, located at 0.9332 and confirmed by the previous level of demand. Throughout this week, the support has been rejected cleanly and it will be important to see the weekly close. Because if it will remain above 0.9323, AUD/CAD long term uptrend continuation will be highly probable.
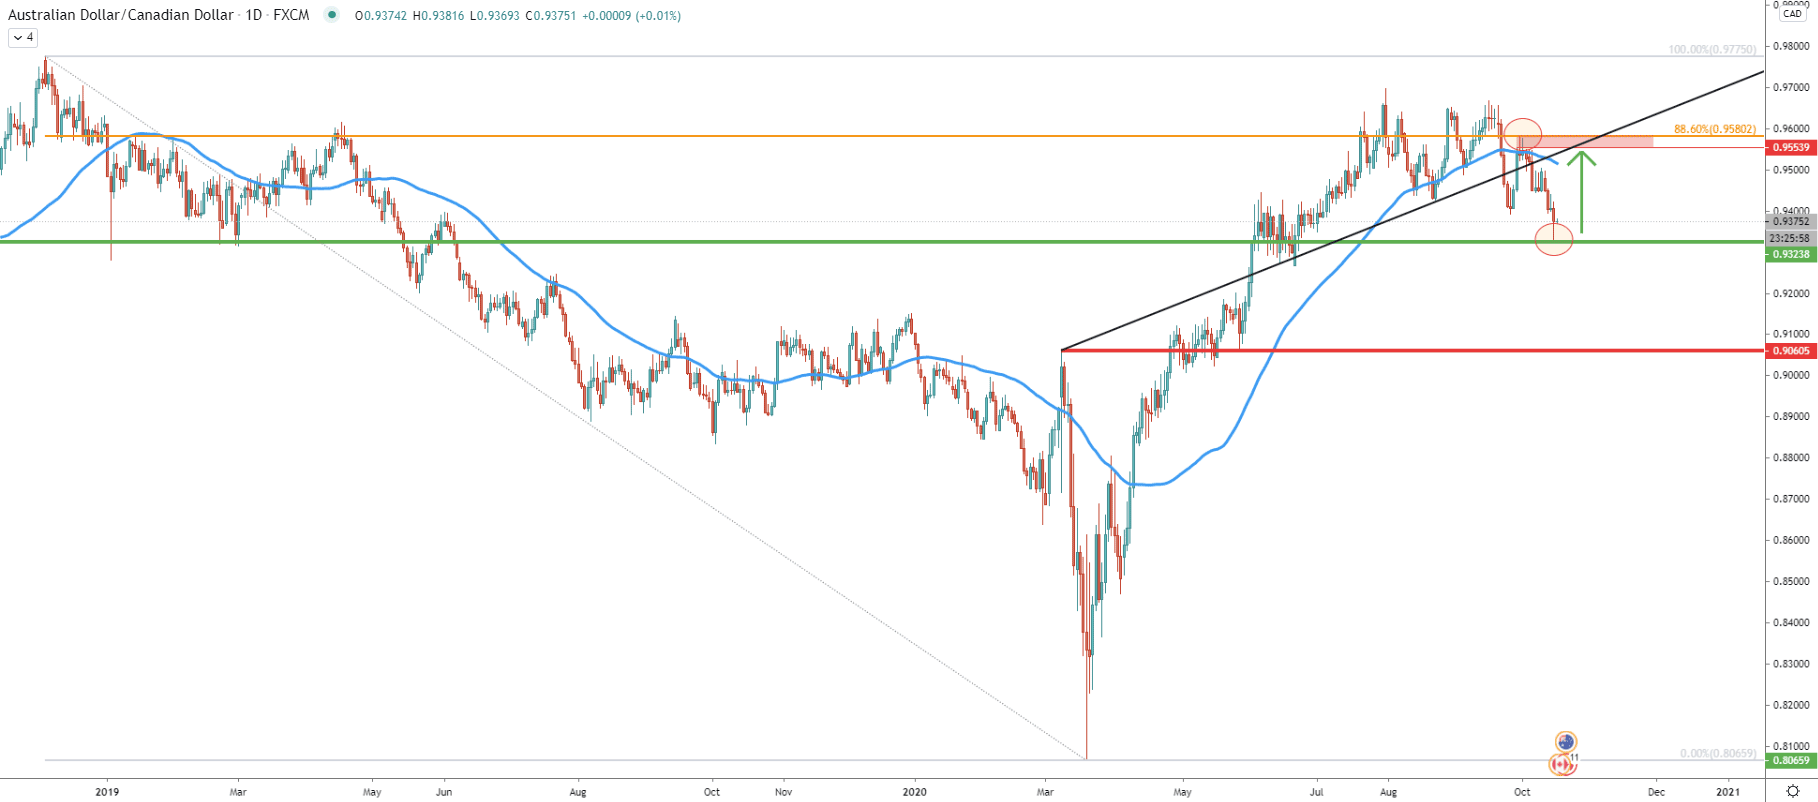
On the daily chart, the key resistance becomes very visible. It is located between 0.9550 and 0.9580 which is an 88.6% Fibonacci retracement level applied to the overall downtrend of 2019. Clearly, this Fibonacci resistance has been rejected cleanly, after which price went down sharply. Although currently, AUD/CAD could be stuck between 0.9323 support and 0.9550 resistance for the time being. If the weekly closing price will manage to stay above the support, an upside move can be expected. Price could be heading up, to re-test the resistance area, which corresponds to the average-price uptrend trendline.
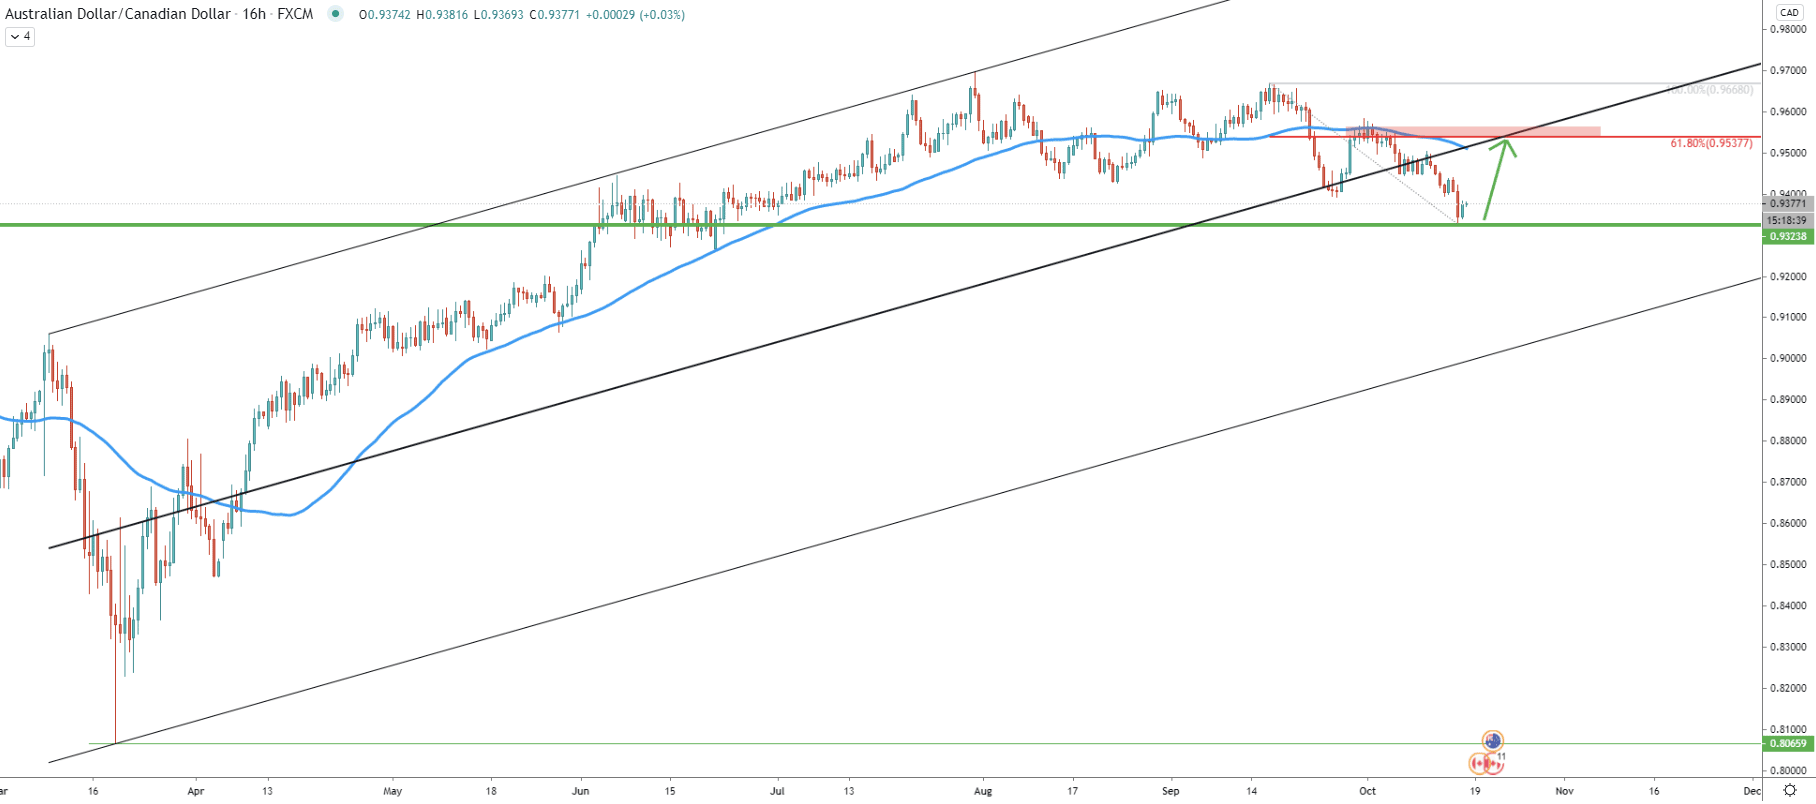
As can be seen, AUD/CAD broke below the middle trendline of the descending channel, which might suggest selling pressure or an extended consolidation phase till the point when the price will test the bottom of the trendline. However, prior to that, a correctional move could take place towards 61.8% Fibs at 0.9537. This price corresponds to the middle trendline of the channel as well as the average-price uptrend trendline as per the daily chart. The importance of the 0.9537 resistance area is highlighted by the rejection of the 50 Exponential Moving Average, which has occurred on the daily and 16-hour charts.
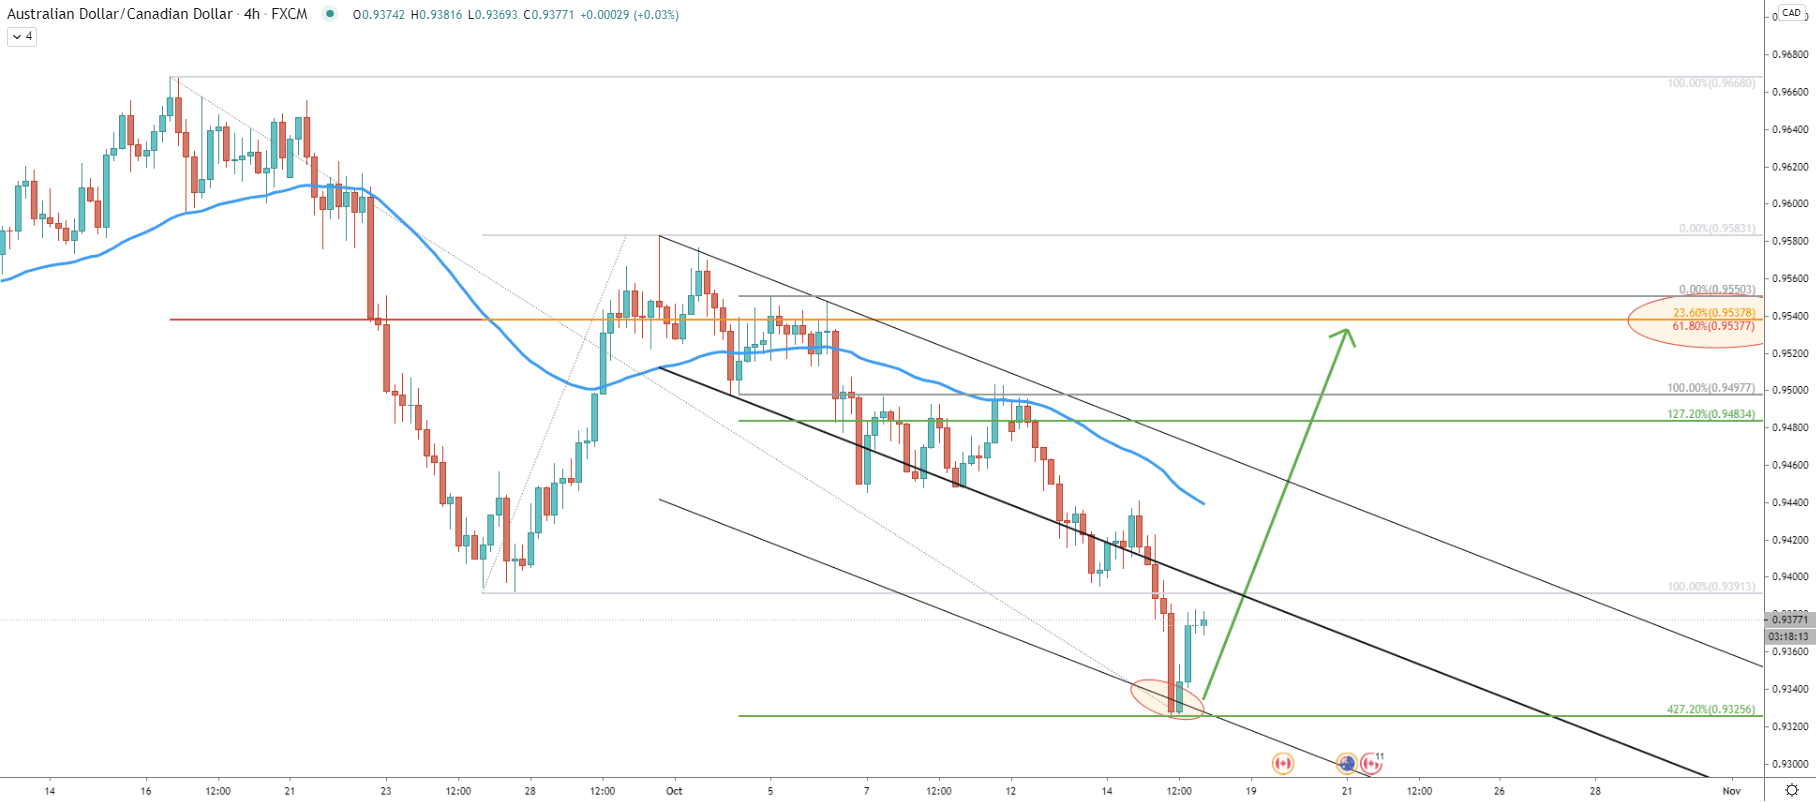
On the 4-hour chart, AUD/CAD has reached the bottom of the extended descending channel. At the same time price cleanly rejected the 0.9325 support level, which is confirmed by 427.2% Fibs applied to the corrective wave up after breaking below the 50 Simple Moving Average. Perhaps the bottom has been formed and as long as the price is above 0.9325, AUD/CAD might be starting to reverse to the upside.
The resistance is now confirmed by two Fibs, the first is 61.8% as per the 16-hour chart. And the second is the 23.6% Fibs applied to the previous corrective wave to the upside. Both of them are exactly at the same rice, 0.9537, suggesting a potential upside move of 160 pips.
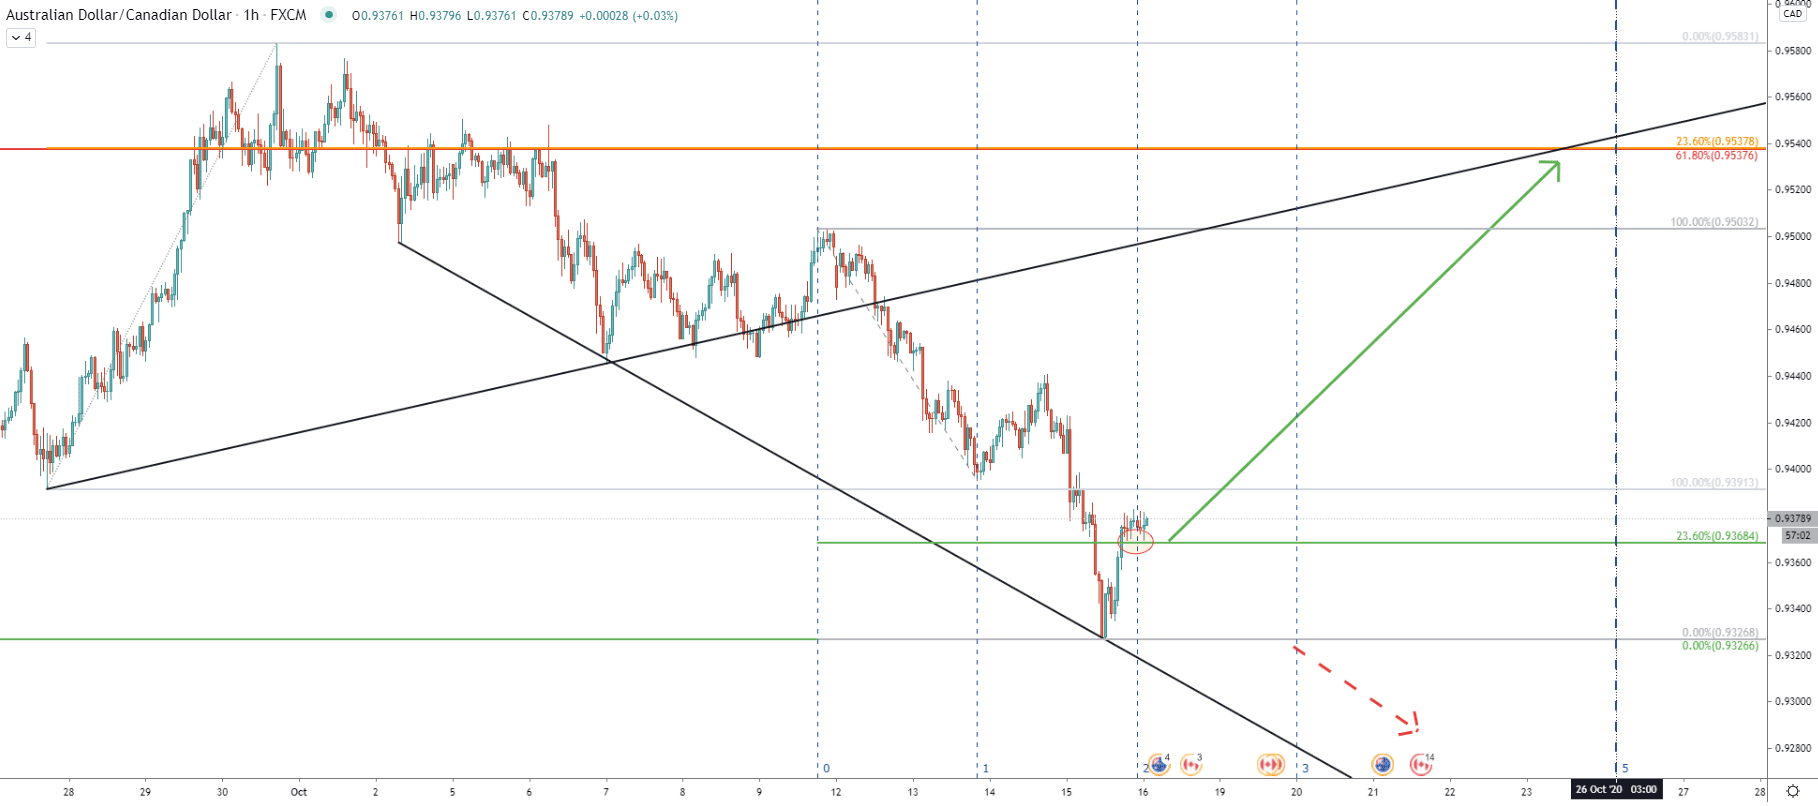
Finally comes an hourly chart, where the price has bounced off the support downtrend trendline. Right now pair is testing the 0.9368 support which is based on the 23.6% Fibonacci retracement level. This is only minor support, but if it holds and AUD/CAD will produce a new higher high, the uptrend could be confirmed. Based on the Fibonacci Time Zone indicator, a new cycle is about to begin, which definitely could be the bullish one. The upside target at 0.9537 corresponds to the average-price uptrend trendline as well as the 5th Fibonacci cycle. This suggests that resistance could be reached as soon as on October 26.
Currently, AUD/CAD is testing a strong support area, which could be of interest to buyers. If the weekly closing price will remain above 0.9326, the price should be expected to continue rising. Especially considering that the new market cycle has just started and the pair is rejecting the 23.6% Fibonacci support as per the hourly chart.
As per the 4-hour chart, the key resistance is located at 0.9537 and is confirmed by two Fibonacci retracement levels. Besides, it also corresponds to the average price uptrend trendline as well as the middle trendline of the ascending channel as per the 16-hour and 1-hour charts.
The probability of a downtrend continuation still remains high. Although as long as the price stays above the recently printed low at 0.9326, AUD/CAD will most definitely start moving to the upside. On the other hand, break and close below the support will immediately invalidate the bullish scenario and the price could be heading lower, potentially to re-test the support downtrend trendline once again.
Support: 0.9368, 0.9326
Resistance: 0.9391, 0.9537