
Published: February 26th, 2020
On February 05, AUD/CAD rejected the 200 Exponential Moving Average, and since then pair has been trending down. It has been quite a consistent decline resulting in a 3% price drop.
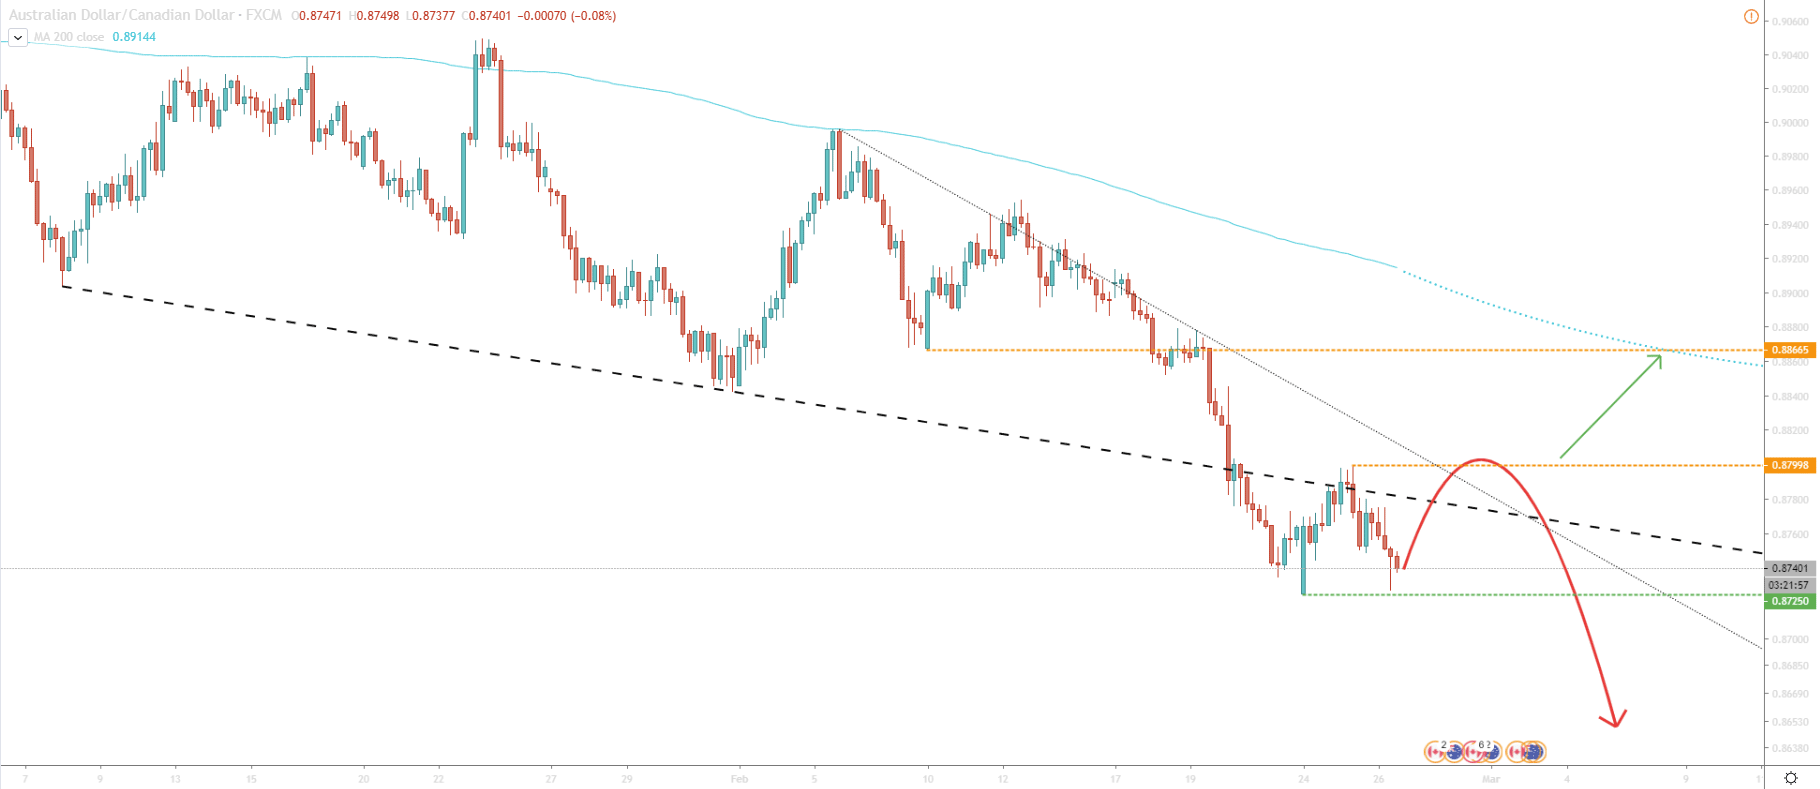
On February 24, 0.8725 low has been reached and today price is potentially forming a double-bottom. Nevertheless, the downtrend remains valid since the trendline support has been broken. But at the same time, a correctional move up can be expected. Price can move towards the downtrend trendline and perhaps even to test the 200 EMA.
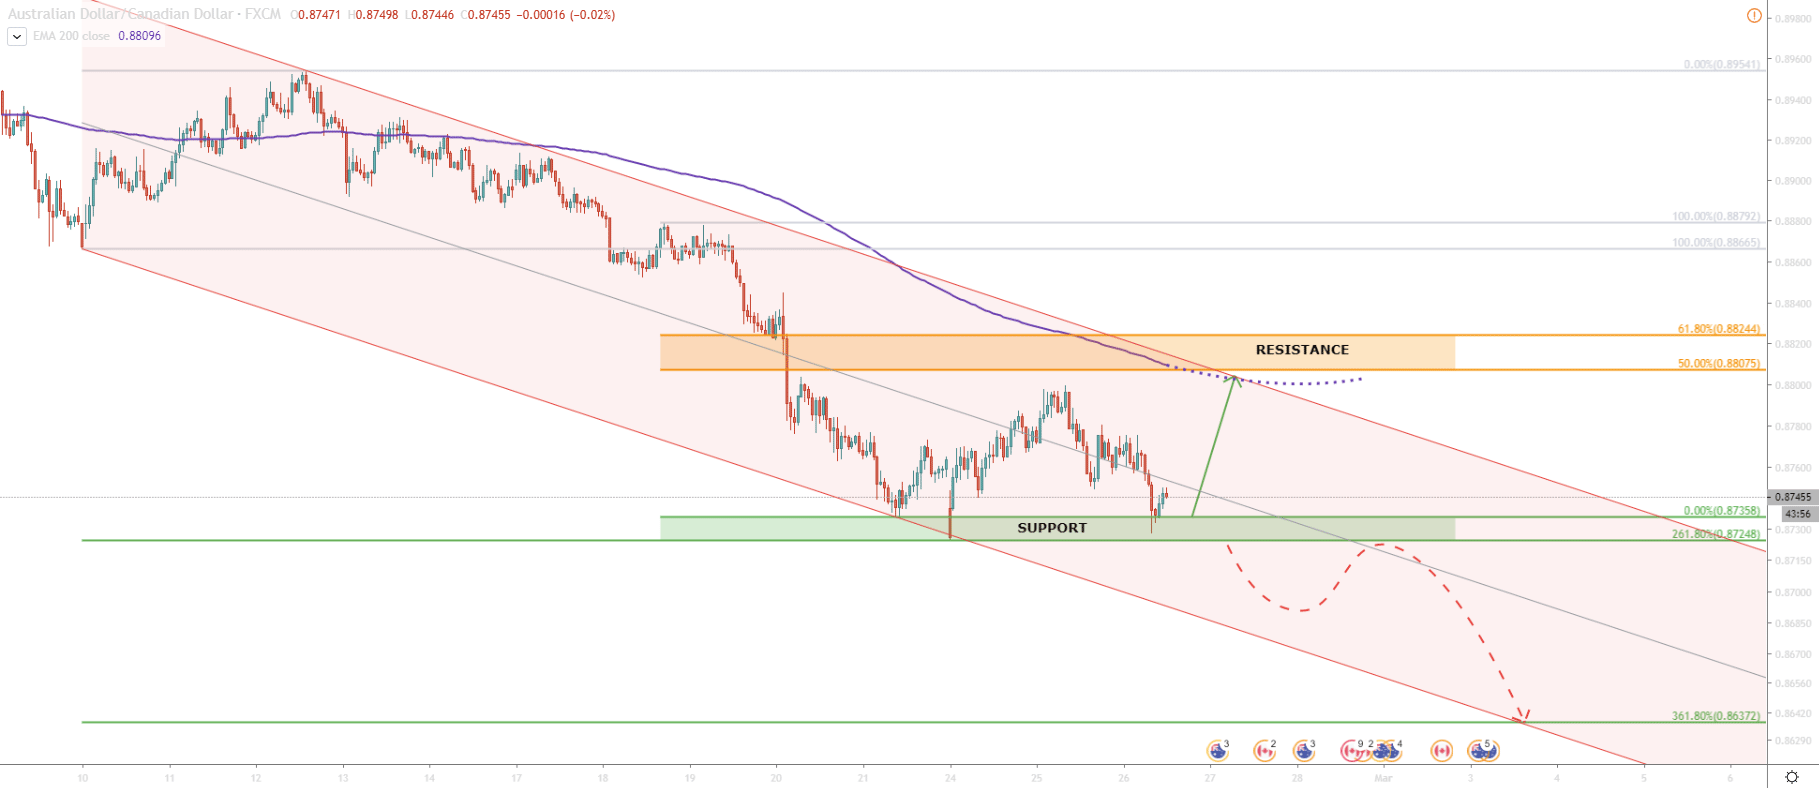
On the 1H chart we can see the price movement within the descending channel, and most of the time it stayed below the 200 EMA. Fibonacci, applied to the 7-12 February corrective wave up, shows that AUD/CAD found the support at 261.8% retracement level, which has been rejected cleanly on February 24. Currently, a double bottom is forming near the 0.8725 support. If that level holds, it is highly likely that AUD/CAD will initiate an upside correction.
The correction can take price up to the 200 EMA which corresponds to 50% and 61.8% Fibonacci retracement. It makes 0.8800 - 0.8825 a strong resistance area and profit-taking zone should the price start moving up. And what is also important, is that the area corresponds to the upper trendline of the descending channel.
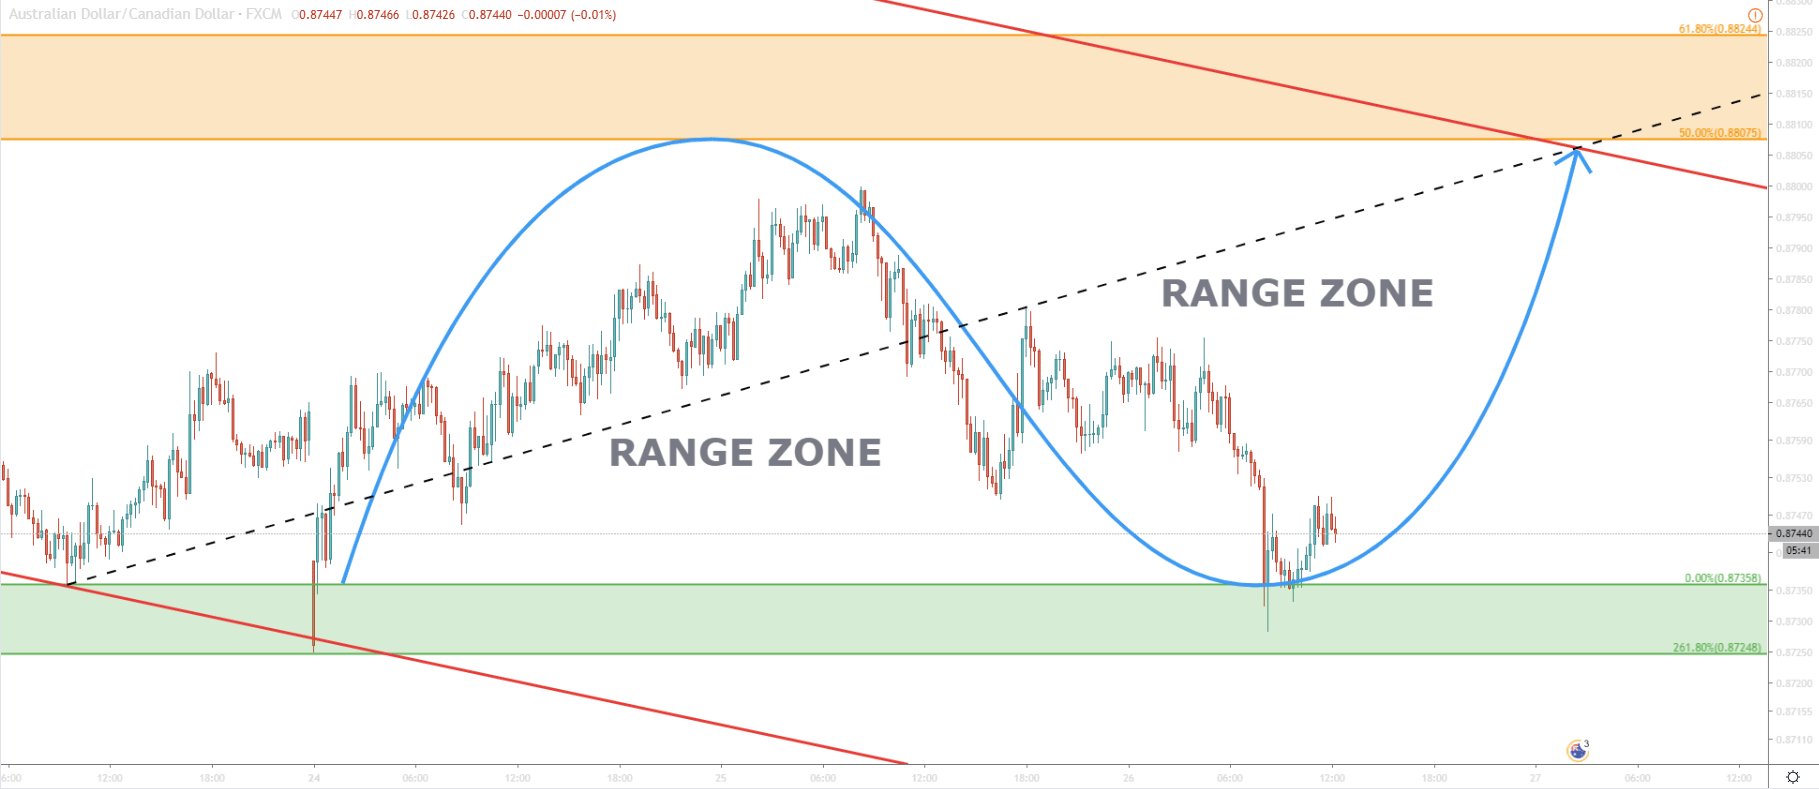
By looking even closer to the recent price action, we can see that range trading can take place in the very near future. AUD/CAD could be stuck there for an extended period of time, but overall sellers might be fixing profit already.
The downtrend seems to be exhausted, especially after the clean bounce of the Fibonacci support level. AUD/CAD can be forming a double bottom, and the consolidation phase is the most probable scenario at this point. Considering that the price is at the bottom of the range, a correction to the upper range boundary can be expected.
Fibonacci is pointing out to two resistance levels,, 50% and 61.8% retracement, which is 0.8807 and 0.8824. This area corresponds to the upper trendline of the descending channel, as well as the uptrend trendline.
We must remember, that the downtrend remains valid, and the price hasn’t even started producing higher highs and higher lows. What we expect currently, is only a correctional move up, because talking about trend reversal is too early. Keeping in mind the ongoing downtrend, AUD/CAD can continue moving lower. Daily break and close below the 0.8725 might trigger yet another selloff, sending price towards next Fibonacci support level at 0.8637.
Support: 0.8735, 0.87247
Resistance: 0.8805, 0.8824