Published: January 6th, 2022
APENFT initiated its business in Singapore in March to work as a pain point in the industry. The core idea of this business is to invest in NFT platforms and artworks, gallery sponsorships, exhibitions, and the publication of NFTs.
In the world of NFT, blockchain technology is a blessing where the APENFT fund might expand its business using this technology. This fund will purchase traditional and well-known NFT artworks as an asset and improve the trading standard. Moreover, this project will support government agencies and other institutions to issue policies to govern the healthy development in the NFTs world.
The three major areas of the blockchain industry are ,below this level alue exchange, collaboration, and record-keeping, and APENFT has a strong presence in all these sectors. Besides its presence in the blockchain industry, the investment in the artwork and other traditional arts will help to leverage the industry by acquiring new technology and policy.
There are 277,080.56B NFT in supply which is 28% of the max supply. The current market capitalisation of this instrument is $840,050,273, but its 24% trading volume increase in the last 24 hours is a bullish sign of this instrument.
Let’s see the upcoming price direction from the NFT/USDT technical analysis:
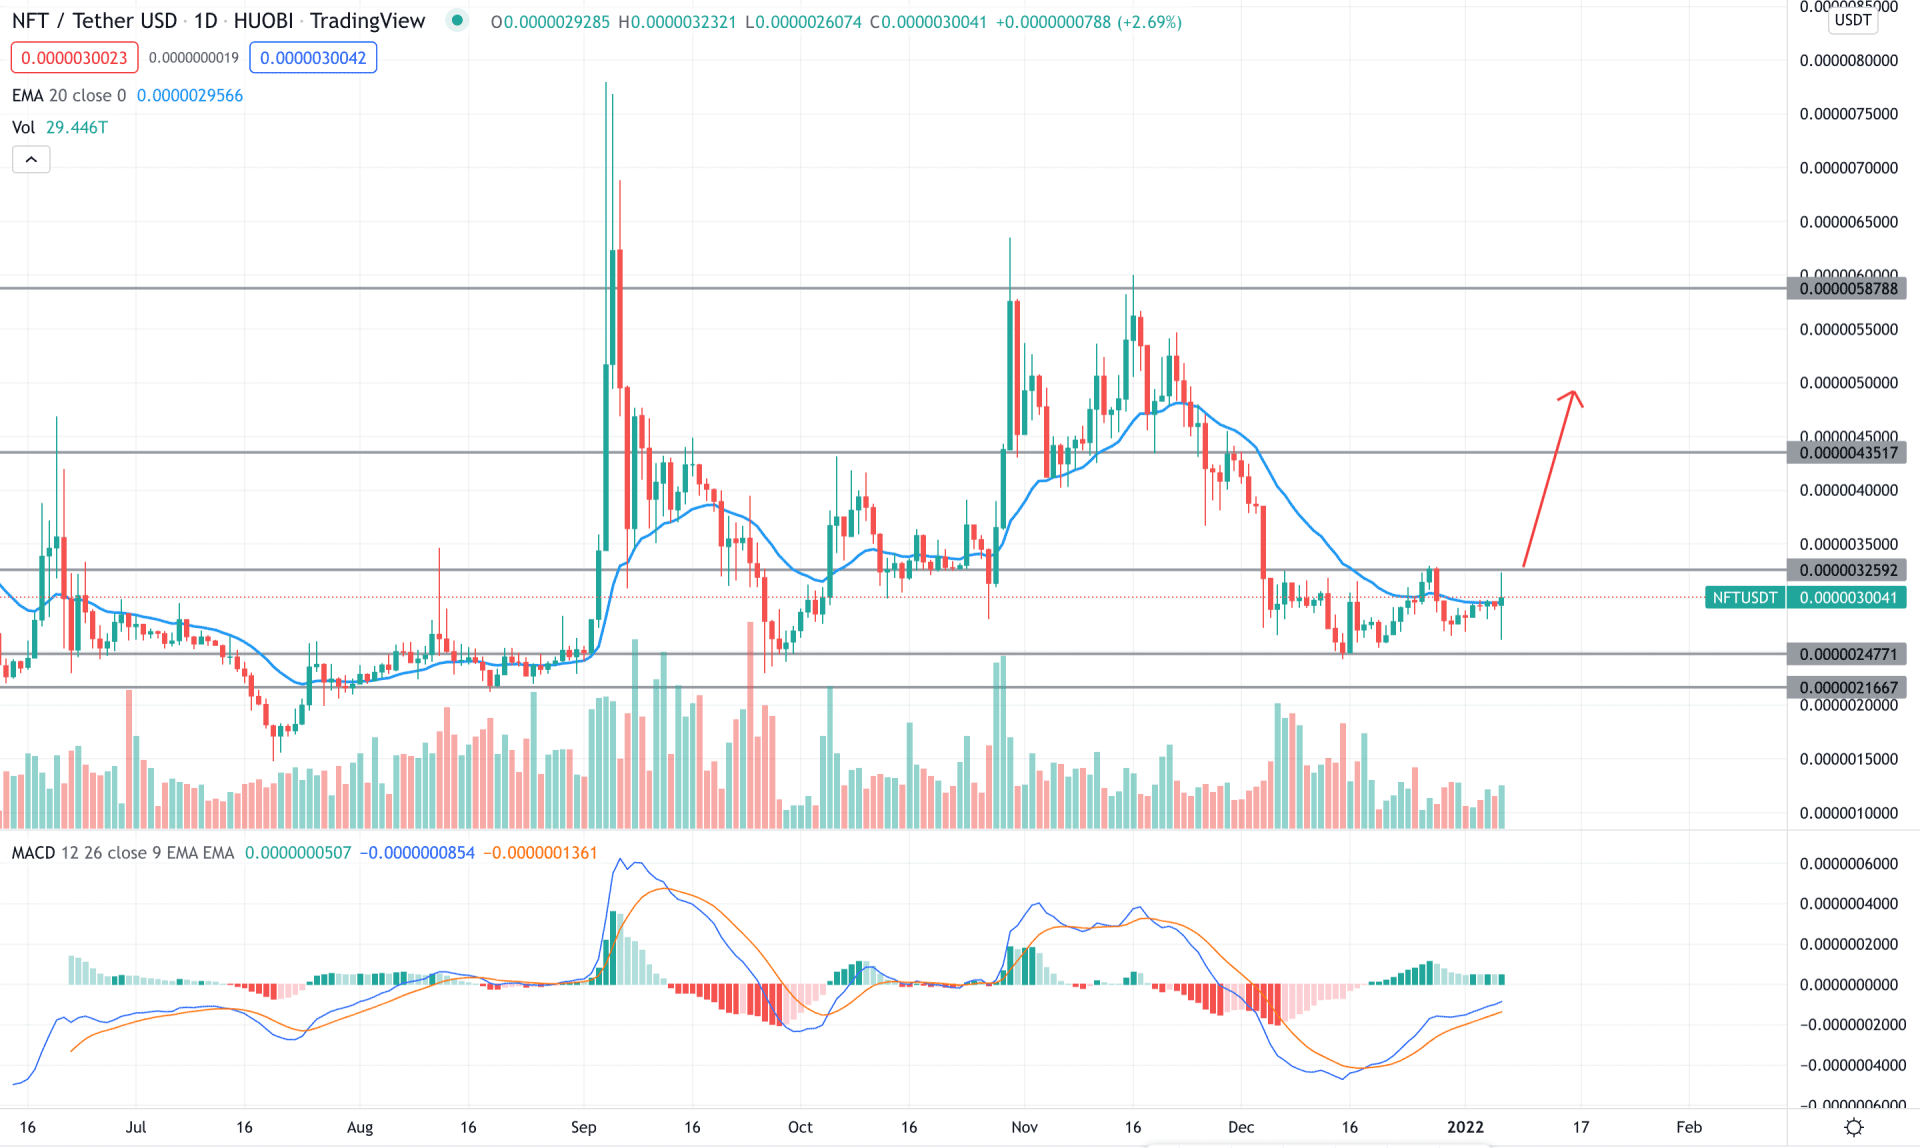
NFT/USDT showed an amazing movement where the price has created multiple swing highs to indicate buyers’ interest. However, after creating a double top at 0.0000058788 level, the price became corrective and moved within a consolidation. Therefore as long as the current price remains within the range between 0.0000032594 to 0.0000024771, investors should look for a bullish breakout before going long in this pair.
The above image shows that the current MACD Histogram is bullish and ranges above the neutral zone. On the other hand, the current price is hovering at the dynamic 20 EMA area. Therefore a bullish breakout above the 0.0000032594 level would increase the buying pressure in this pair where the primary target would be 0.0000053517 areas.
On the other hand, investors should closely monitor how the price breaks out below the 0.0000024771 support level where 0.000021667 would be another buying opportunity. However, below this level, the price may consolidate more before showing buying pressure.
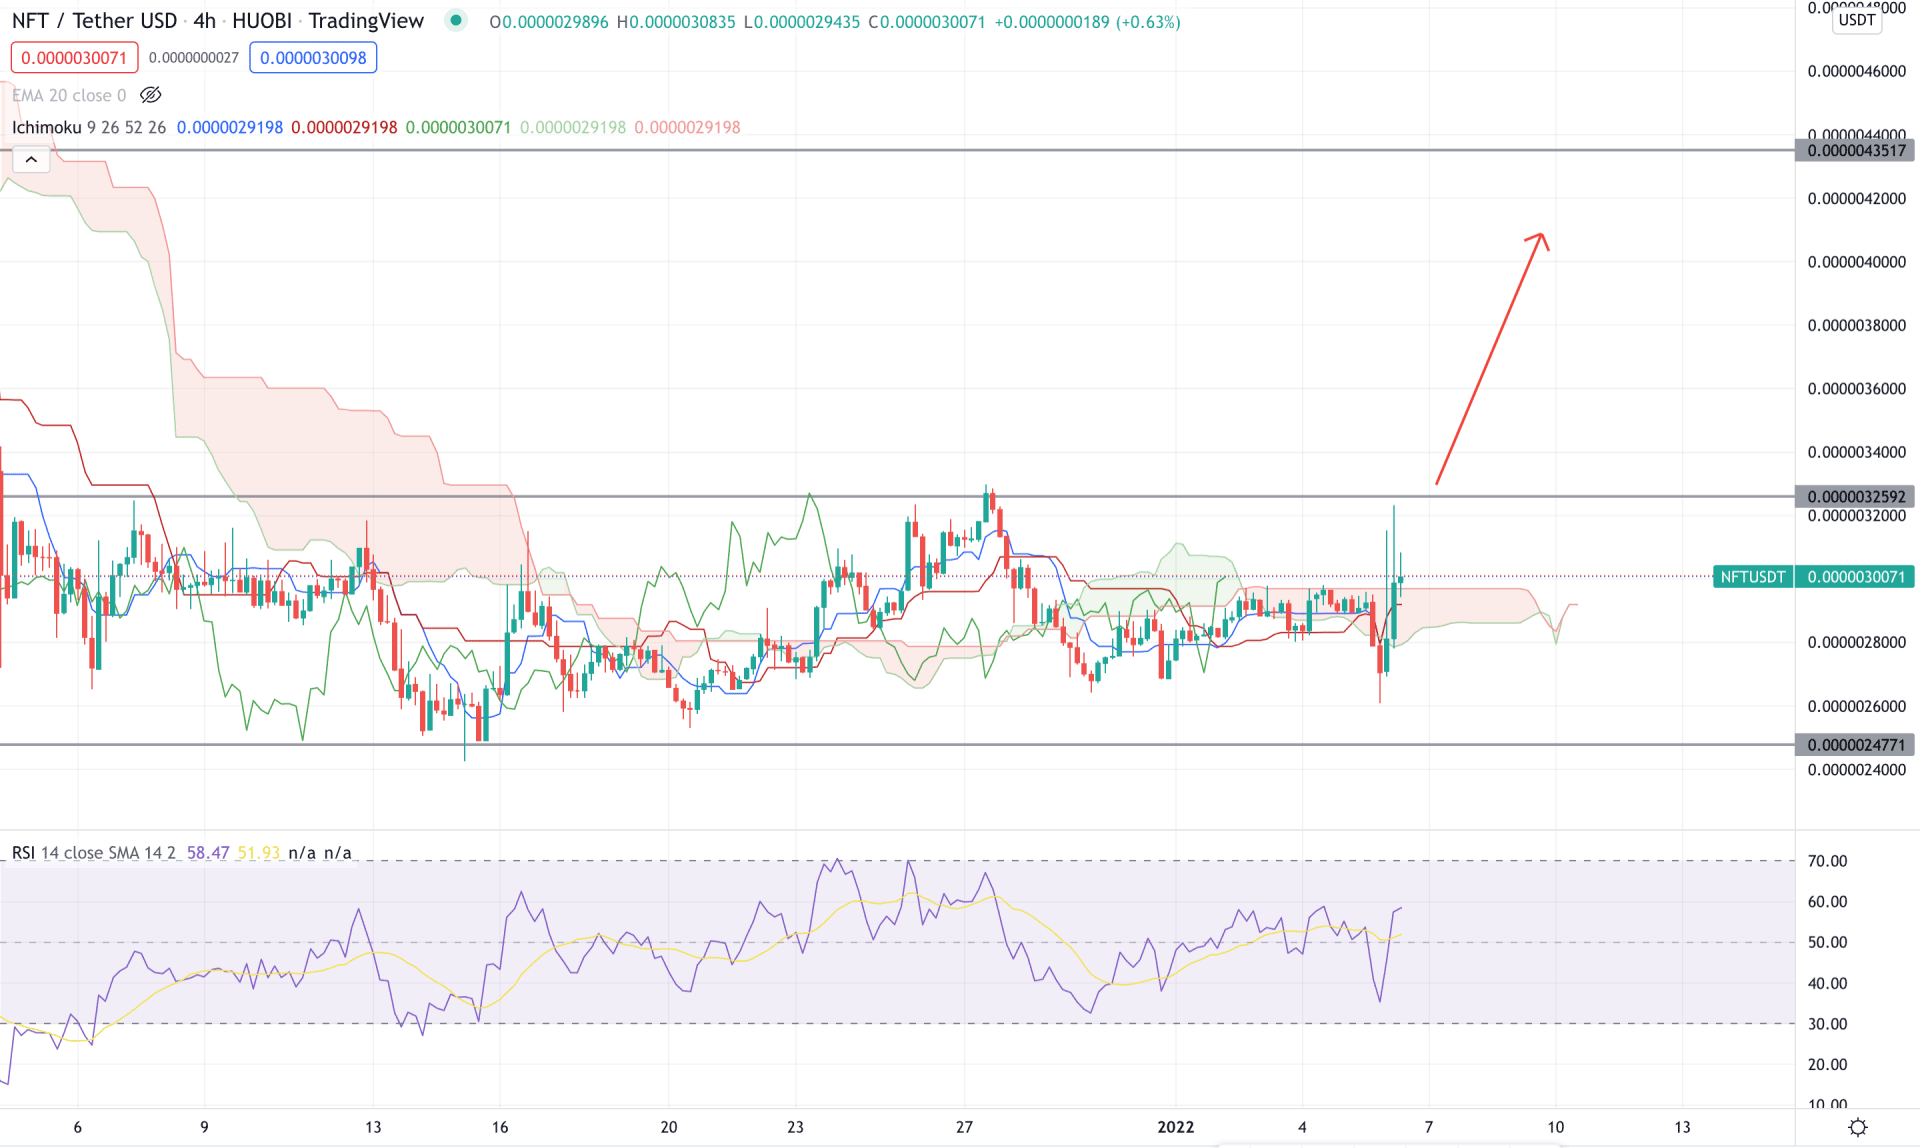
According to the Ichimoku Cloud, the H4 chart in NFT/USDT showed a neutral momentum as the current price is trading within a range. However, the recent false breakout below the Kumo Cloud with an attempt to breach the 0.0000032592 signifies that bulls are interested in taking the price higher. As a result, the future cloud has changed its direction while the Lagging Span is above the price.
In the indicator window, the RSI is above 50 level and aiming higher. In that case, the RSI has a higher possibility of reaching the overbought 70 level with a bullish momentum in the price. Moreover, the recent price moved above the dynamic Tenkan Sen and Kijun Sen, indicating that short term and medium-term investors are bullish.
Based on the h4 context, investors should wait for a stable price above the Kumo Cloud to rely on the possible buying opportunity in this pair. In that case, a bullish breakout above the 0.0000032592 is more likely to take the price up towards the 0.000005000 level.
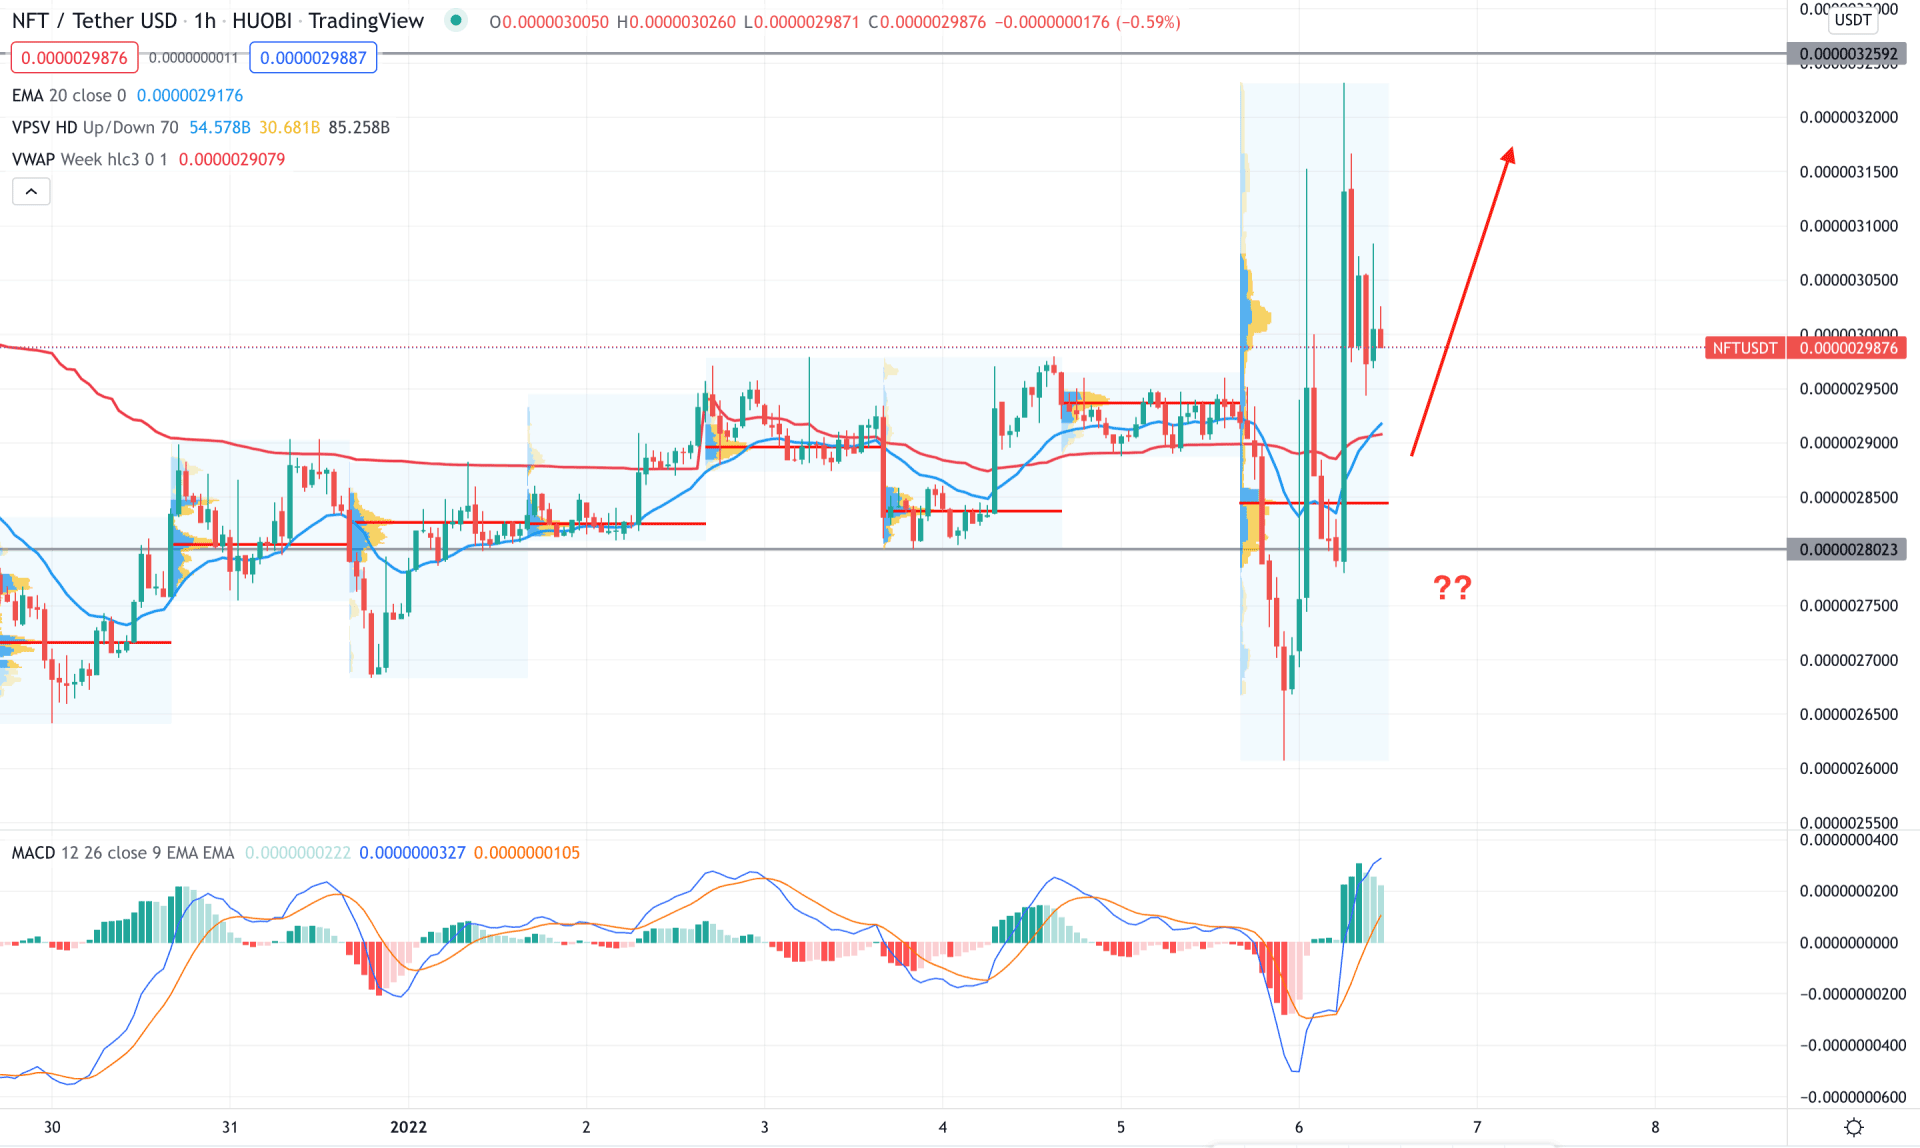
In the intraday chart, NFT/USDT is trading within a lot of volatility where the price showed a SL hunt at the previous range. However, the failure to get stable below the 0.0000023000 level with a bullish H1 close above the dynamic 20 EMA signifies that bulls are interested in this pair.
The above image shows that the MACD Histogram turned bullish and held a strong position where the MACD line aimed higher. Meanwhile, the current price is trading above the dynamic 20 EMA and weekly VWAP, while the most recent high volume level is below the price. Therefore, as long as the price trades above the 0.0000023000 static support and weekly VWAP, it is more likely to extend the bullish momentum towards the 0.000005000 level in the coming days.
According to the current observation, the daily chart shows that NFT/USDT buying sentiment may find momentum after a bullish breakout. However, the intraday price has already provided a bullish sign where any bullish rejection from dynamic levels would be a reliable bullish opportunity in the H1 chart.