This article discusses the least volatile and the most volatile currency pairs in Forex and how to trade them. By now you must have known that volatility in a currency pair is what dictates to a large extent the amount of money you either make or lose in a position. There are many factors or indicators that can be used to measure volatility. However, these are mostly not important when you are actually trading these currencies in the markets.
In discussing this topic, you should also realize that many Forex platforms offer not only these Forex pairs, but also CFD assets that are in various asset classes. These asset classes include Stocks, Energies, Indices, Bonds, ETFs, and Cryptocurrencies. Within each of these asset classes, there are assets that are very volatile and there are also assets that are not as volatile. There are also entire asset classes that are very, very volatile. So the way you would trade the least volatile currency pairs or the least volatile financial instruments wouldn't be the same way you would trade the more volatile ones.
Let us delve further into the issues raised in this topic.
What is volatility in forex trading? The simple definition of volatility is the fluctuation of the prices of financial instruments. Volatility is the measure of the difference between the opening prices of an asset and its closing prices over a specific period of time.
Volatility can also be described as a measure of the variability of price movements from the standard. In the financial markets, volatility is used to simply describe the extent of the price swings on an asset within a certain period.
Volatility is what produces trading opportunities in the financial market. How much money you make trading a forex pair or a CFD instrument will depend on the degree of volatility in that asset. In other words, volatility is a measure of the range of price movements within an asset over a certain period of time, which could be over a day, over two days, over a week, or a month.
How do you determine which currencies are the most volatile and the least volatile? Various studies have been done to compare the price ranges of several currency pairs over several years, and these ranges were broken down into the average price ranges per day.
Based on the information gathered from these studies, a table of the average volatility (in points per day) for the most volatile and least volatile currency pairs reveals the following:
Most volatile currency pairs:
Least volatile currency pairs:
To put it all in context, the charts below are added to show how volatile two of the currencies on this list are. The price ranges over a chosen period for the GBPJPY and USDMXN are shown, and contrasted with the GBPUSD.
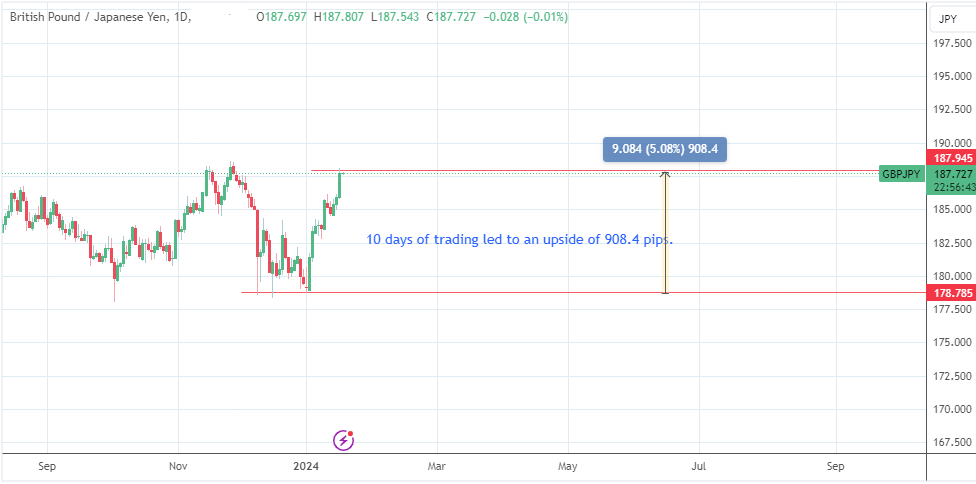
GBPJPY: Daily Chart
Here is the GBPJPY, which had a move of 908.4 pips in 10 days of trading. Compare this with the GBPUSD, which had only 171 pips in 5 days.
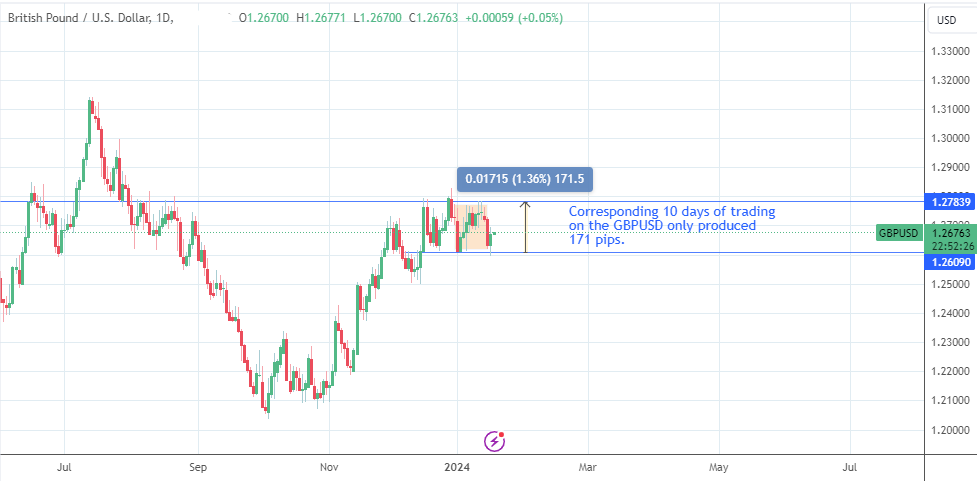
GBPUSD: Daily Chart
Finally, compare these with the USDMXN, which had a performance of 5762.5 pips attained in 7 days.
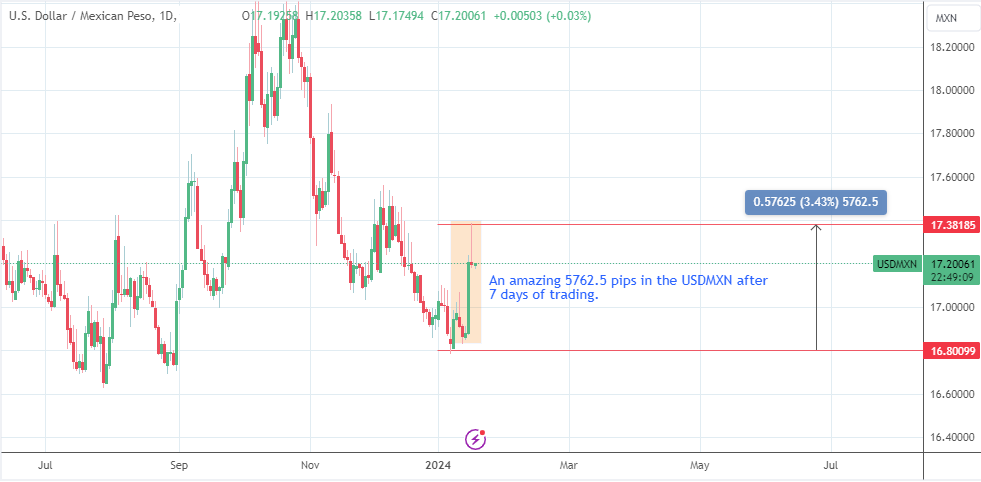
USDMXN: Daily Chart
It is very clear that some currency pairs are much more volatile than others and cannot be traded in the same manner.
The significant factors influencing currency pair volatility usually come from specific economic news data in the Forex News Calendar. These risk events include interest rate expectations or interest rate changes, inflation data, and other country-specific data that are relevant to the macroeconomic situation of the countries in question, such as economic growth, manufacturing data, PMI data, or data that has to do with industrial production or factory output. Employment data are also a key influence of currency pair volatility. Let us now look at these factors in detail.
Some news events tend to produce heavy market volatility. The most important ones are listed below.
► Interest rates
We have just come out of a cycle of rate cuts and rates increased by central banks worldwide. During the onset of the COVID-19 pandemic in 2020, many central banks worldwide were forced to cut interest rates to near zero levels to relieve the global economy that the economic consequences of the pandemic had battered. Access to cheaper capital and cheap or free money from the various stimulus programs led to a situation where a lot of money was chasing very few goods and services.
Remember that the pandemic led to widespread shutdowns of various sectors of countries' economies. When the lockdowns were lifted, the capacity to satisfy the demand for goods and services from the population flush with cash was minimal. This set up a situation where inflationary trends took hold of many economies worldwide, and inflation levels hit sky-high levels that had not been seen in two or three decades.
Central banks were forced to respond to the inflationary trends by raising interest rates, some to levels that had not been attained in two or three decades. In many emerging market economies, interest rates increased by even double-digit figures, all to combat inflation. However, the snag with raising interest rates so aggressively at such high levels is that they end up stifling the economy even if they control inflation. As the cost of capital and the cost of credits goes up, it impacts businesses' abilities to continue running profitably. It also makes it impossible for homeowners to finance their mortgages at cheaper levels, and rent costs increase. It also makes it hard for employers to keep on employing people.
So, eventually, a high-interest rate environment will produce an economic recession. Central bankers are aware of the facts, and that is why, after hiking interest rates, they step into the cycle of cutting interest rates to normalize the monetary policy once the inflationary targets have been reached.
In between the cycles of rate cuts and rate hikes by central banks, there are always the market expectations of where interest rates will go, and the scale of rate hikes, pauses or reductions and for how long. These expectations drive volatility in the currency pairs with volatile nature, and when the changes are eventually made to the interest rates, they produce very volatile price action on these currency pairs.
► Inflation rates
Inflation is the benchmark commonly used by central banks to make interest rate adjustments. Whenever the world is in an atmosphere of central bank rate adjustments, inflation data become one of the main drivers of currency pair volatility. The key inflation data are usually the Consumer Price Index, Producer Price Index, and the various average earnings indices across several countries, which measure wage inflation.
► Economic growth
As mentioned earlier, economic growth has become a key driver of price action post-COVID due to the impact of the pandemic itself, and also the effect that changes in interest rates have on the economies of countries. As long as countries continue their march towards recovering from the impact of the pandemic, there will be volatility impacts on currency pairs. As long as there are the most volatile currency pairs in the market, there will be these effects ongoing.
Geopolitical events refer to the actions taken by governments in response to certain factors or currencies. These include acts or threats of war, political tensions within a country, highly contested elections, and key government officials' or policymakers' pronouncements.
These geopolitical events tend to cause severe market volatility because they are unexpected occurrences, and their impacts are usually unknown beforehand. Often, there is also no precedent to give traders a clue as to how much of a market impact those events will have.
In addition, some geopolitical events are not warm-up occurrences but tend to stretch for weeks or months. For instance, acts of war or civil conflict can stretch for months or years, and during this time, the action may expand to involve other players on the contract. The fact that certain countries control certain commodities and industrial raw materials that are globally important tends to make geopolitical events a key driver of market volatility.
This scenario means that there are financial instruments that will inherently have higher volatility than others (crude oil, gold, USDNOK, etc).
What is liquidity? Liquidity is a measure of the volume of trades in a financial instrument or asset. Liquidity will determine how easily, or how quickly a buy or sell trade is executed in the forex market. If there are many buyers and sellers, or there is a high buying volume and a large selling volume to match the buying volume, it is easier to match the orders at the lowest possible cost.
Picture this. Someone wants to buy $10,000 with Euros. No matter how much the Euro seller comes with, there has to be at least $10,000 up for sale or the order will not get matched.
In a situation where there is high liquidity, it simply means that there is always enough volume of a counter-asset to match the original order of the trader. For instance, if you want to purchase 100 million dollars using British Pounds during the New York session, you will be able to do so easily because there is a large volume of US dollars in circulation during the New York session. There will not be difficulties getting a sufficient quantity of US dollars to exchange for the large volume of British Pounds. On the other hand, if you try to purchase Japanese Yen during the New York session, the Tokyo or the Asian markets would have been asleep by then, so you will be hard pressed being able to exchange your British Pounds for Japanese Yen during the New York session. And this is what makes the spreads much wider and also what causes greater volatility in such an asset. So, in summary, the more liquid an asset is, the less volatile that asset would be and the lower the trading costs. But the less liquid an asset is, the more volatility and the trading costs.
The most volatile currency pairs are those currency pairs and CFD assets that display heavy volatility. This volatility manifests as the wide swings of price movement that tend to occur in these assets. Examples of highly volatile currency pairs include the following: GBPJPY, EURJPY, AUDJPY, USDMXN, USDZAR, USDNOK, USDTRY, USDBRL, USDINR, USDSEK, NZDJPY.
A careful look at these pairs will show that some of these currencies are the minor currency pairs (Yen crosses, commodity currencies), exotic currencies (Norwegian Krone, South African Rand) and others are currency pairs featuring emerging market currencies (Turkish Lira, Mexican Peso).
Trading any currency pair is not just about strategy. Getting the perfect result is a combination of strategy and proper risk management. The latter is especially important as a trading account that is not properly risk-managed will not survive the wild swings of these currency pairings.
Here are the different parts of the strategy component of trading when handling the most volatile pairs.
► Use breakout strategies
Breakout strategies work very well for most volatile currency pairs. It is in their very nature to break out of price ranges. Wherever you see periods of consolidating or retracing price action, these are simply the activities of traders driving the trend, taking a break or taking profits before they re-enter to reassert their strength in pushing for more volatile trading. Therefore, patterns showing periods when the price takes a break before it breaks out are some of the best tools to use in trading strategies for the most volatile pairs.
Here is a breakout trade taken from the USDMXN.
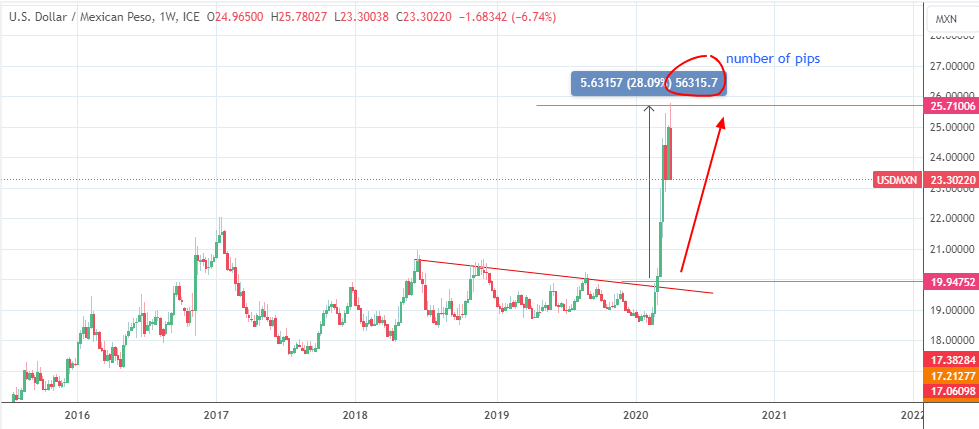
USDMXN: Weekly Chart
This trade was taken off a weekly chart. Look at this breakout move on the USDMXN pair. Price broke above the trendline resistance and powered upwards by a whopping 28.09%. A 28% move in forex is a HUGE move, and for this move, the pip gain was 5631.57 pips. Once the price had broken above the descending trendline and the 19.9475 resistance, it registered a massive 5631.57 pips move before the price reversed.
This move played out over 4 weeks, and this is how much the trader would have made by trading 1 mini-lot on this currency pair.
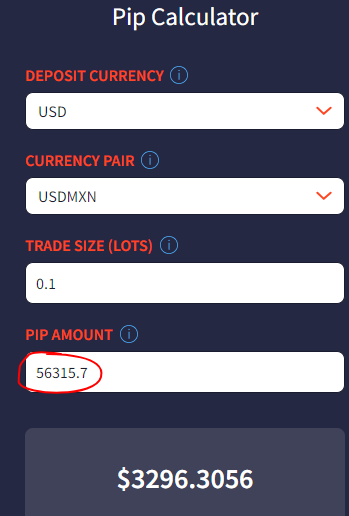
This is the earning potential that trading off a long-term chart on the most volatile currency pairs can do. Not only will you not have to be staring at charts all day long, you can be sure of a sustained, lengthy move that delivers a sizeable profit when the move goes in your direction.
► Reduce your position size and do not use tight stop losses
One thing you must remember is that the most volatile currency pairs tend to have very large spreads. This means that your account goes into steep negative territory once you make a trade entry. Therefore, any profits you are aiming for must factor in the large spreads, the potential for heavy drawdowns, and the sufficiency of your account capital to endure these two factors.
Due to the wild swings in price when trading the most volatile currency pairs in forex, it is important that you make allowance for these wild swings in such a manner that your account is protected. That means, you need to reduce your position size and use generous stop losses. Volatile currency pairs are not where you want to use tight stop losses because they will be taken out most of the time.
► Trade off the long-term charts
Another strategy many traders fail to employ when trading volatile currency pairs is trading off the long-term charts. The long-term charts refer to the daily or even the weekly charts. For instance, looking at the weekly charts of some of the volatile currency pairs will show that many have well-defined chart patterns. Suppose these patterns play out over several days or weeks and eventually reach their price objective. This would mean that the trader would have to reduce the initial size to ensure that the wide swings between entry and the end of the trade objective do not end up ticking the account in the deficit or ruining the stock loss due to the drawdown. Using the long-term charts might require the trader to reduce the initial size to ensure that the trade objective does not end up sending the account in an irrecoverable deficit or generating a massive loss due to drawdown.
Here is an example to illustrate this point. The chart below is taken from the USDMXN (US Dollar versus Mexican Peso), and is from the daily time frame.
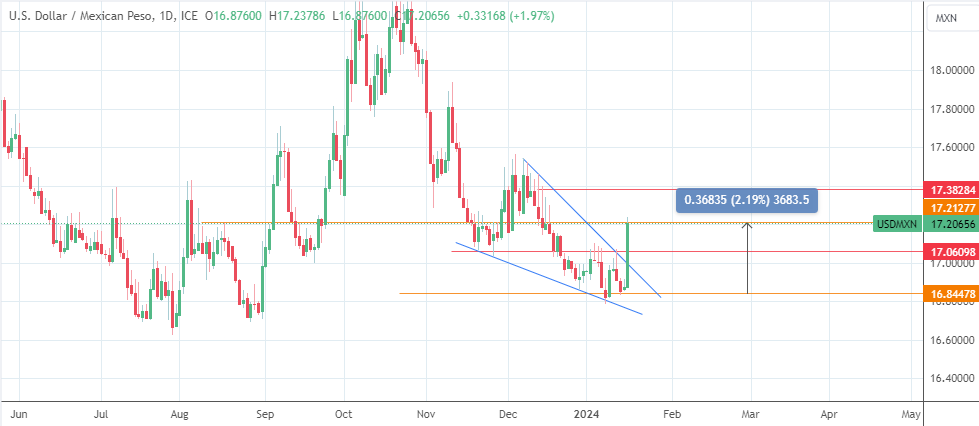
Three signals pointed towards a BUY trade:
The long green candle that initiated the breakout was a massive 368.35 pips. Reducing the trade size to 0.1 lots (1 mini-lot) would still have earned the trader $368.35, quite a decent return on a single trade.
Some traders would have set up the position by initiating a feeler trade of 0.01 lots, then going in sequentially with 0.09 lots to complete the desired trade size. This is best done on short-term charts where you can see what is happening to the price on a microscopic level. But for those who do not want to go through the emotional rollercoaster of watching such a volatile trade, simply using such patterns on long-term charts always delivers.
When trading a currency pair with wild price swings, the trader may not know how much the price could move in the years to set stop-loss before conceding the actual trade. So many traders get caught in the trap where the stop-losses they use are too tight. Furthermore, they also have the issue of not having adequate account capital that can withstand the drawdowns that could follow from such adverse price swings. In that background, the best bet for a trader, as per risk management, is to use very small positional sizes, say a maximum of 0.5% of the account size.
Institutional traders usually set up what we call feeler trades. In other words, they use very small account capital to gauge how much the market could move. Once they know the extent of the price swing, either in the trade flow or against the trade, they are now in a better position to use larger account sizes to set up dealer trades. So the best thing you would do as a little trader is to mimic this behaviour. Use an account size or a lot size that does not exceed 0.5% of the account in the dealer trades. Once you have this dealer trade on, allow it to perform for some time, probably for an hour or two, to see the extent of the price swing before you go all in with the desired positional size of your choice.
The least volatile currency pairs are as follows: EURUSD, USDJPY, GBPUSD, USDCHF, HKDUSD, USDSGD, AUDNZD, CADCHF, AUDCHF, EURCHF, CHFJPY.
A look at the currency pairs in question will reveal that they are pairs that are the most liquid pairs in the market (EURUSD, GBPUSD, USDJPY, USDCHF) or are pairings of economies whose fundamentals are similar (AUDNZD). The least volatile currency pairs are those which command large trading volumes and as such, record small price movements during a set period. The major currency pairs in forex are part of the least volatile currency pairs.
The major currencies (EURUSD, USDJPY) tend to trend more than the currencies whose fundamentals are similar (AUDNZD, HKDUSD). This means that the strategies you will use to trade the various categories of the least volatile currency pairs will be different.
Trading any currency pair is not just about strategy. Getting the perfect result is a combination of strategy and proper risk management. The latter is especially important as a trading account that is not properly risk-managed will not survive the wild swings of these currency pairings.
Here is how to apply the strategies and risk management components for trades involving the least volatile pairs.
► Use trend-following strategies
Some of the least volatile currencies tend to follow short trends and are amenable to trend following strategies.
One of the trend-following strategies has to do with the entry when the currency pair is already in the trend. Currency pairs do not move in a straight line whenever they are in the trend. There are always periods when the price action will undergo a retracement. The retracements come as early entry trades will be closed for profit-taking, and new entrants who were waiting for an opportunity to jump on the train, do so.
Most traders will not catch the trend initially, but they can enter it when there has been a retracement. There are many ways to enter into a trend using retracement strategies. Some can use the Fibonacci retracement tool to perform the entries, or you can use other tools such as the Gann lines, Gann fans, the 2/3rds retracement rule, and other similar retracement tools.
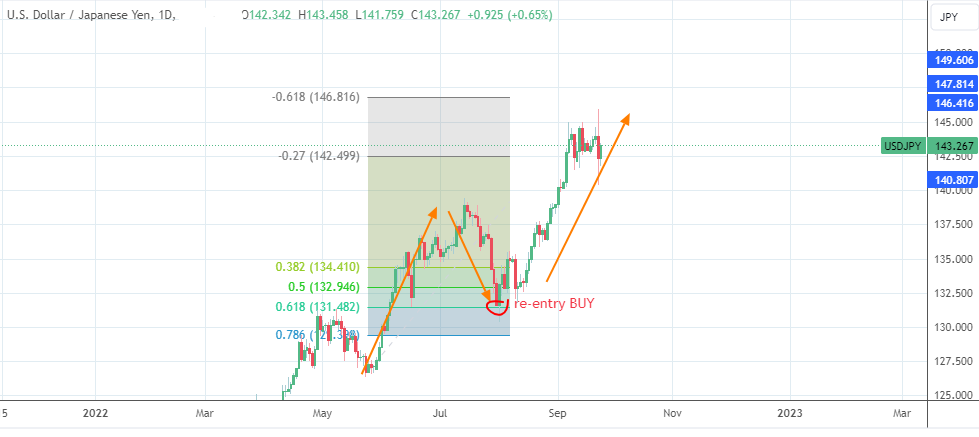
EURUSD: Daily Chart showing retracement BUY re-entry
In this example, we can see that the USDJPY is in an uptrend, but there was a period when the price retraced to the 61.8% Fibonacci retracement level. At that point, a re-entry BUY would have been a valid call and would have produced a reasonable amount of profit.
► Use range-trading strategies
Range trading periods are periods of consolidation. At these times, the highs of the price are found in a tight resistance range, and the lows of the price are also found in a tight support zone. At these times, you can aim to buy at or near the support zone to sell at resistance using long orders, or you can sell at resistance and take your profit when price gets to the support zone.
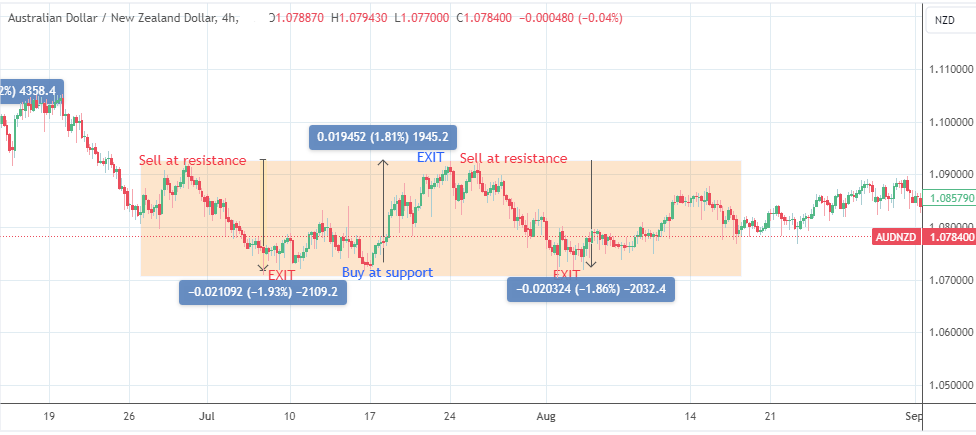
AUDNZD: 4-Hour Chart
Look at the typical range trades on the AUDNZD, a pair highly suited to this strategy. There were two opportunities to sell at resistance and one opportunity to buy at support. The average pip range for the trades was somewhere around 202.87 pips i.e (194.52 + 210.92 + 203.24)/3.
Please note that these trades occurred on a 4-hour chart. When trading the least volatile currency pairs, it is not advisable to use long-term charts such as the weekly or monthly charts, unless the trader is a swing or position trader.
Risk management principles for trading the least volatile currency pairs follow the normal risk management patterns that have been described in many articles on this site. In summary, here are the ways to apply risk management when trading the least volatile pairs.
► Hedging
If your broker allows it, hedging is a good risk management strategy that can be deployed. Instead of setting a stop loss, you can set a trade on the same currency pair to trigger in the opposite direction if the original trade has moved against your position by a fixed number of pips. That way, you prevent losses from exploding and can actually maneuver both trades to your benefit. This requires experience and is not for beginners.
► Position Sizing
There are position-sizing tools online that can help you work out what lot sizes to use in relation to your account capital, to hit a certain level of profit if the trade goes according to plan. FX-List has listed many brokers that have position sizing tools to help you with this.
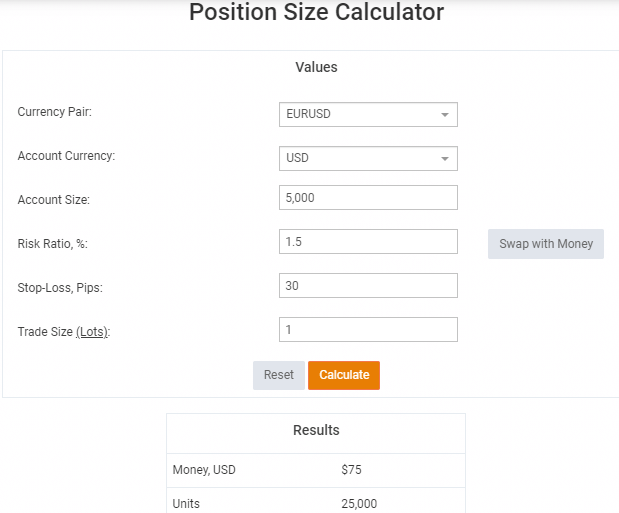
By adjusting the various parameters, you can come up with a position size that you are comfortable with, and which will not put your account in jeopardy if the trade does not work out.
► Risk-reward
You can use risk-reward ratios as a component of your risk management strategy. By using 1:2 or 1:3 in terms of risking 1 pip for every 2 or 3 pips gain you seek, you can end up profitable even when you lose more trades than you win.
For instance, a trader who trades 20 times a month and chases a 1:3 risk-reward ratio can afford to lose up to 12 trades and still end up profitable.
You can now extrapolate the figure using your lot sizes to know what the pips gained translates into in monetary terms.
Always take note of current market conditions. Historical volatility in a currency pair does not provide an indication of future volatility. The risk tolerance and current market environment are things the trader must take into account with trading the most volatile and least volatile assets.