
Published: April 18th, 2024
The recent upward trend in the XAUUSD price can be attributed to prudent trading amid the escalating geopolitical tensions in the Middle East.
In an interview published by state media on Wednesday, Jordan's Foreign Minister Ayman Safadi cautioned that regional tensions could potentially escalate into a catastrophic conflict if Israel retaliates against Iranian strikes, as reported by Reuters.
Additionally, on Wednesday, the Israel Air Force declared its target of Hezbollah infrastructure located north of Baalbek in eastern Lebanon. This development has sparked apprehension regarding the potential for an additional outbreak of hostilities between Israel and Hezbollah.
Israeli Prime Minister Benjamin Netanyahu underscored the autonomy of Israel in self-defense, whereas Western nations advised exercising restraint in reaction to Iranian aggression.
In the interim, the US Dollar Index (DXY) declined, with subdued US Treasury yields exerting the greatest influence. This dollar depreciation aims to increase the cost of gold for investors utilizing alternative currencies.
Moreover, Fed Chair Jerome Powell indicated on Tuesday that recent data indicates modest advancements in attaining the inflation target of 2%, alluding to the possibility of a more aggressive approach in forthcoming monetary determinations. Increased interest rates may reduce the appeal of non-yielding assets such as gold.
Let’s see the upcoming price direction of the yellow metal from the XAUUSD technical analysis:
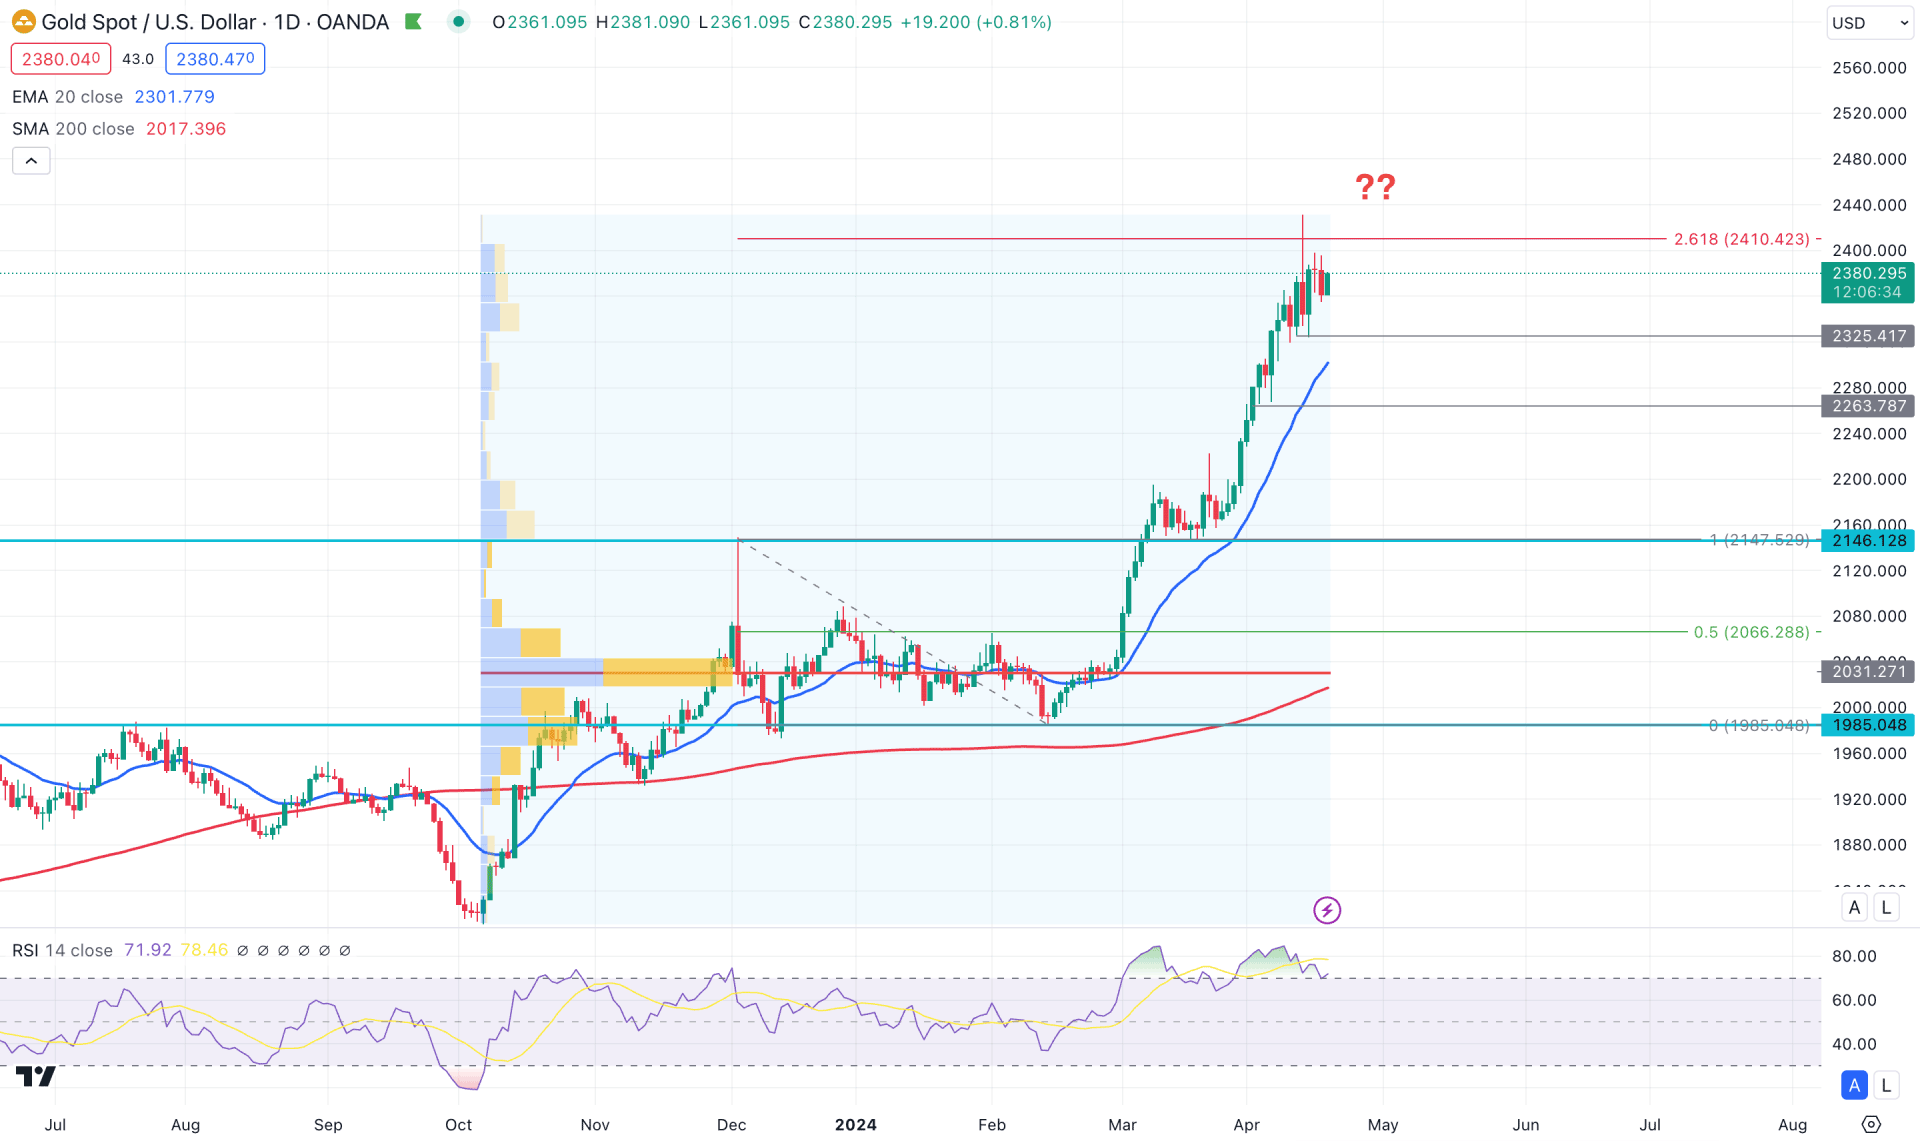
In the daily chart of XAUUSD, an impulsive bullish pressure is visible, supported by the rising demand due to geopolitical tension. As a result, the price spiked higher and reached a record high in 2024, with no valid sign of downside pressure.
In the higher timeframe, March 2024 showed a positive close in the monthly time frame, which was followed by a continuation in the running month. The weekly price shows a consecutive 5 bullish closes, which might work as a confluence bullish factor for this instrument.
In the volume structure, the ongoing buying pressure is valid as the largest activity level since October 2023 is at the 2031.27 level, which is clearly below the current price. However, the high volume level is the first indicator to suggest a minor downside possibility, as the gap between the price and this line has expanded significantly. As the long-term trend is still valid, investors might need more clues before opening a short position.
As for the daily chart, the dynamic 20-day Exponential Moving Average hovers below the current price and works as an immediate support. The major support of the 200-day Simple Moving Average is way below the current price, which suggests a potential downside possibility. Also, the Relative Strength Index (RSI) hovers above the 70.00 overbought line, with a potential divergence with the main price.
Based on the daily market outlook of XAUUSD, the price reached the crucial 261.8% Fibonacci Extension level and formed a bearish exhaustion in that area. However, no significant high volume is seen at these zones. Therefore, any bullish continuation, with a daily candle above the 2400.00 psychological line, could be a potential long opportunity in this pair, targeting the 2450.00 and 2500.00 area in the coming days.
On the other hand, the mean reversion possibility could be a valid sell signal, which needs confirmation by forming a stable market below the 20-day Exponential Moving Average level.
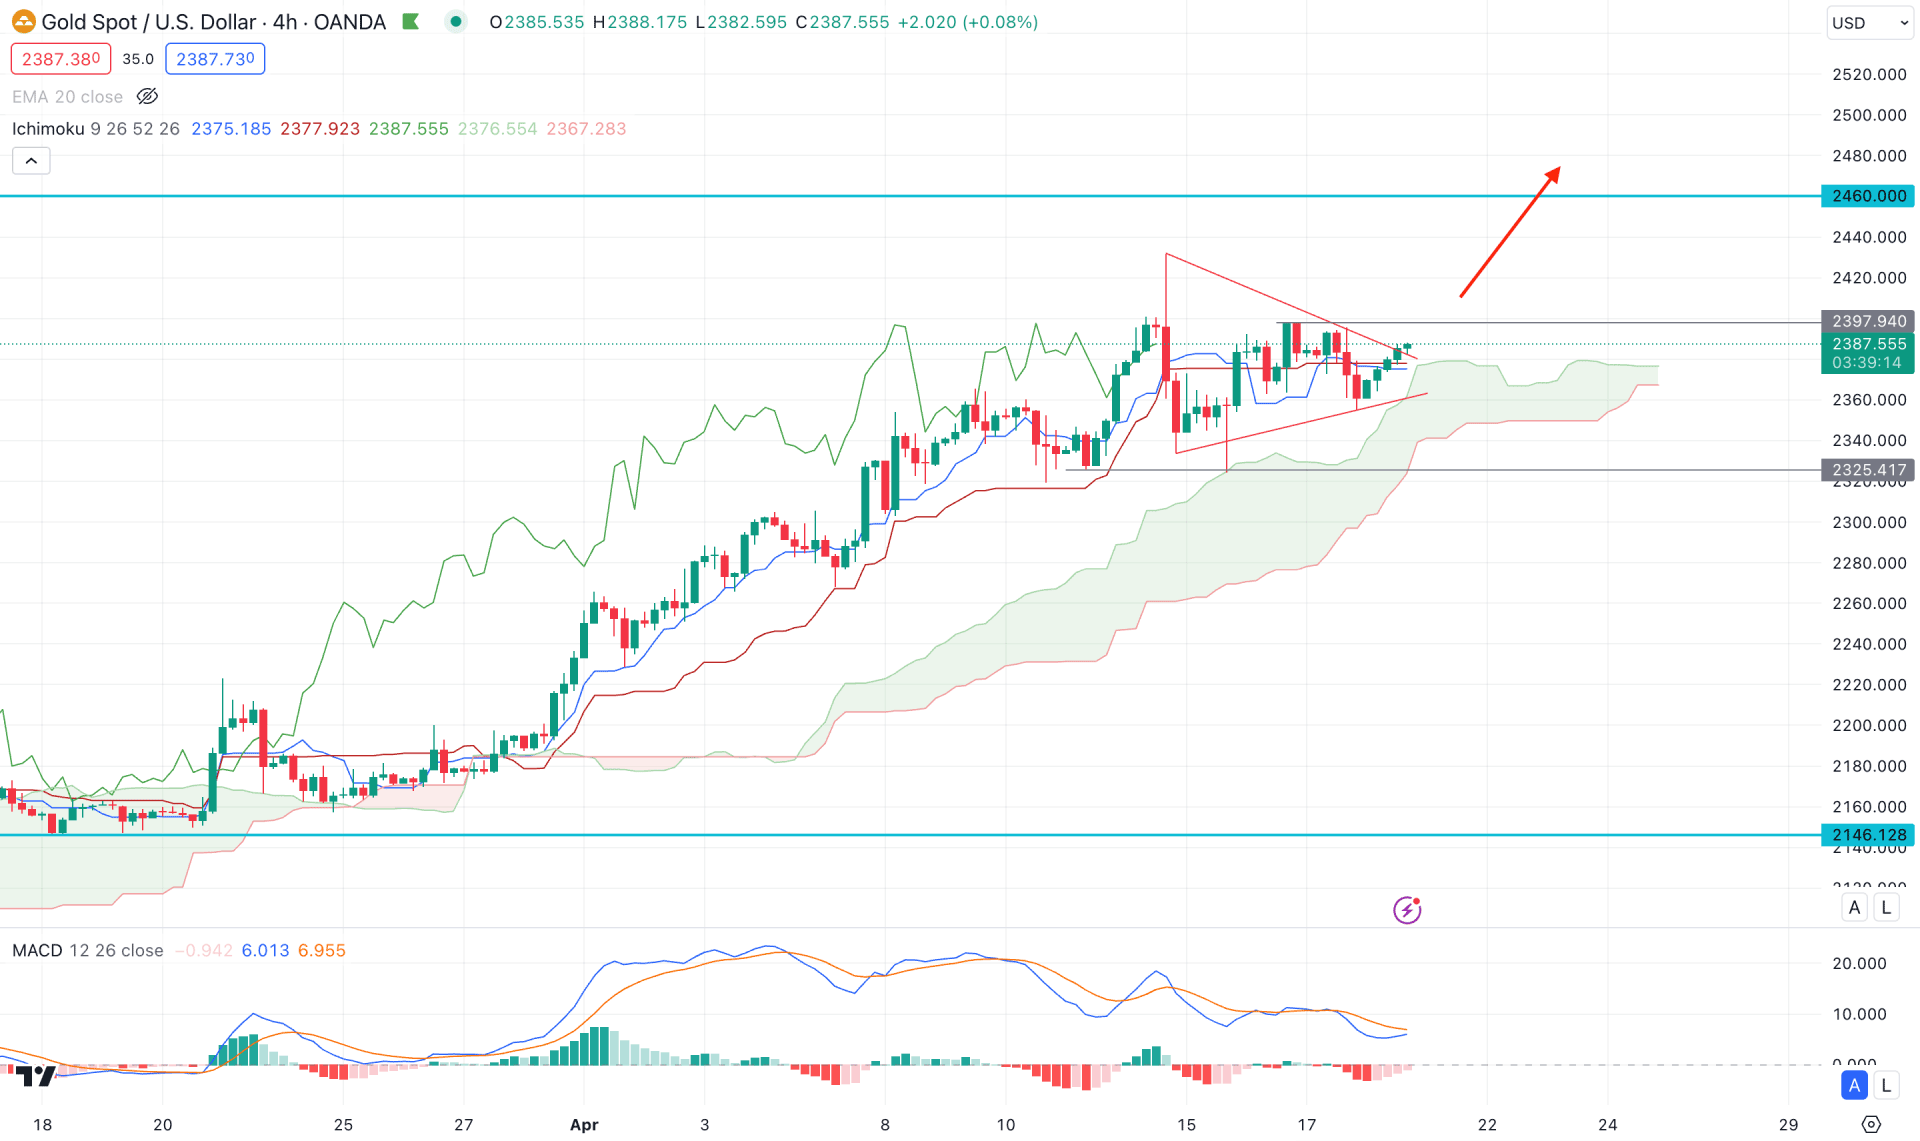
In the H4 timeframe, the overall market pressure is bullish as the most recent price showed a downside correction and found the Ichimoku Cloud as a valid support. The thickness in the future cloud suggests a corrective market pressure, which might end up with a trend trading opportunity.
The indicator window shows a similar outlook, where the current MACD Histogram failed to hold the bearish pressure multiple times. However, a potential divergence is visible with the MACD Signal line, which might signal a primary indication of a bearish reversal.
Based on this outlook, investors should closely monitor the symmetrical triangle formation in the H4 chart. A valid bullish pressure with an H4 candle above the 2398.00 level could be a potential long signal, targeting the 2460.00 area.
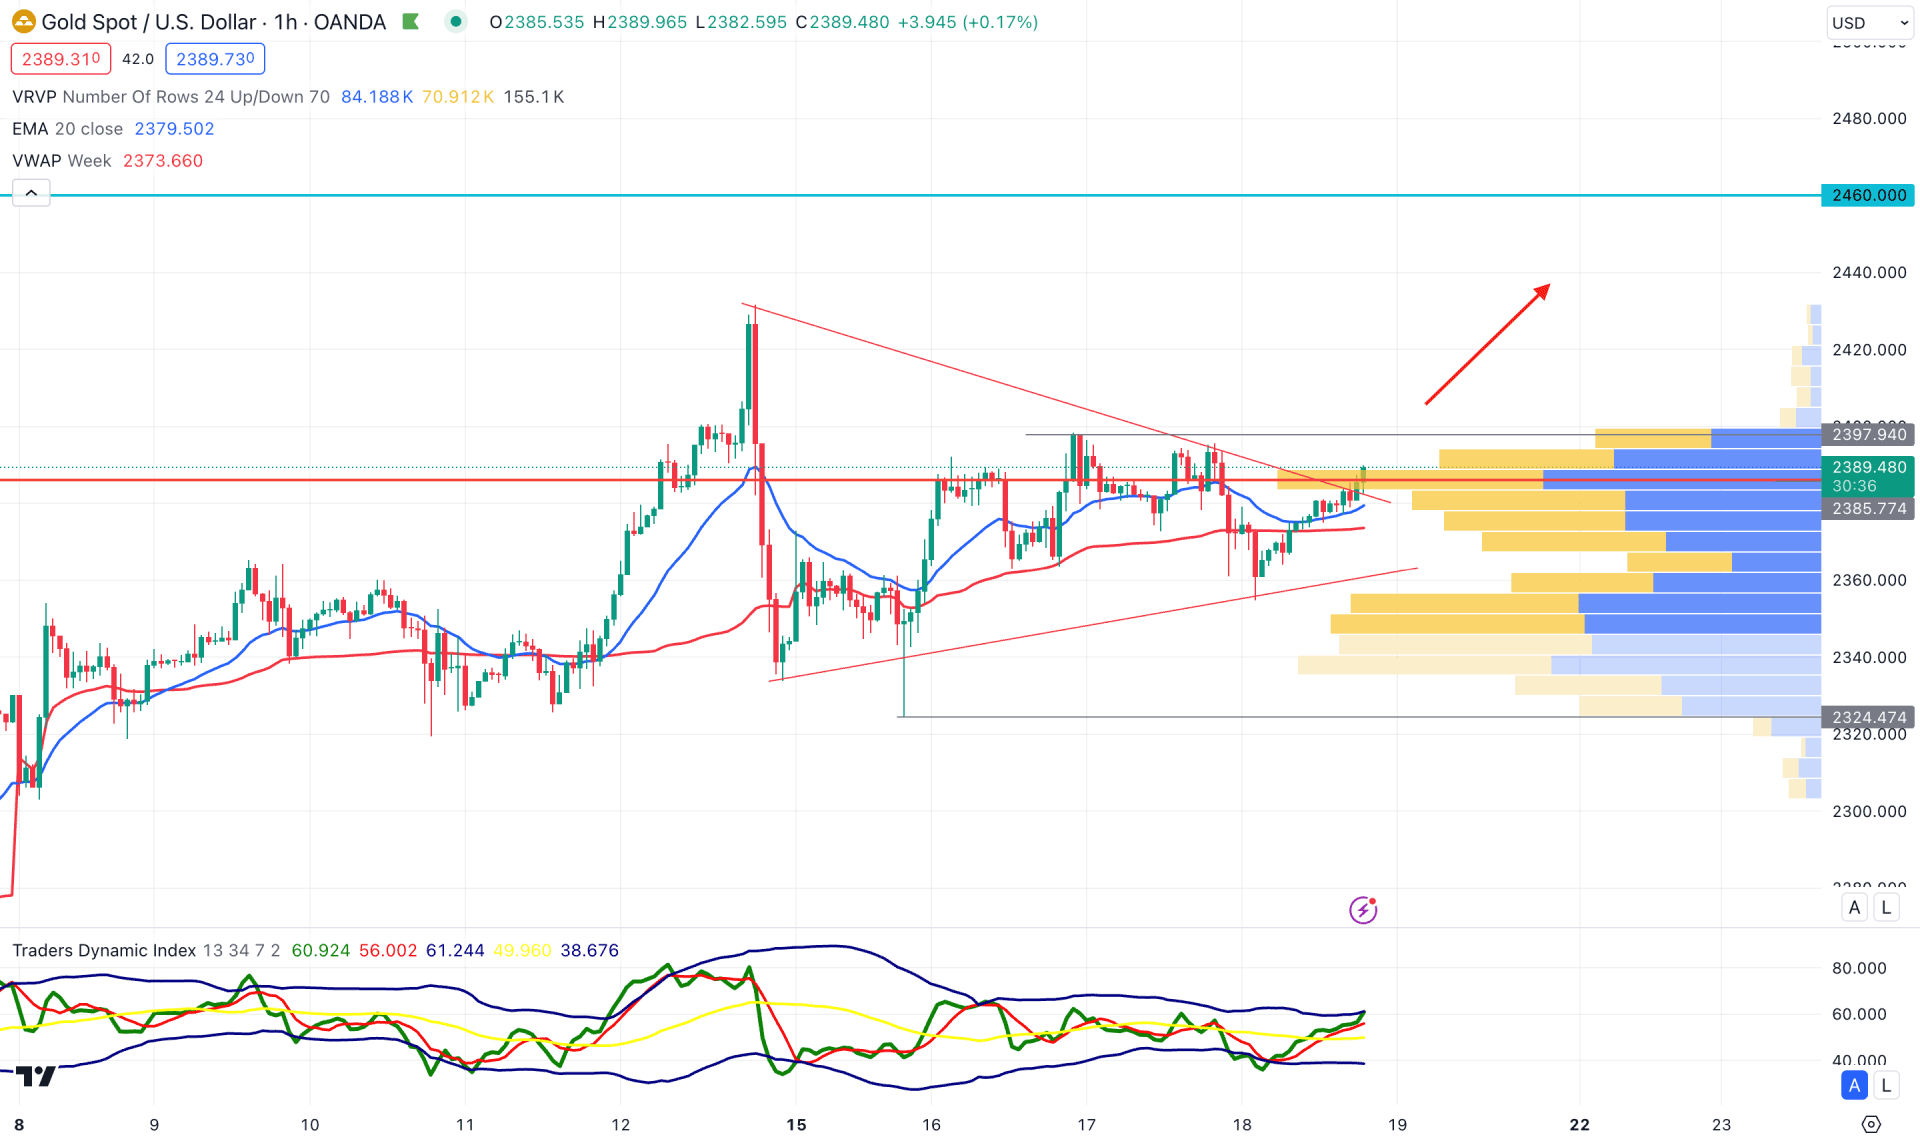
In the hourly chart, the bullish pennant pattern is clearer. The most recent price hovers at the symmetrical triangle resistance level. Moreover, the visible range high volume level supports the buying pressure by remaining just below the current price.
In the indicator window, the Traders Dynamic Index (TDI) remains above the 50.00 line for a considerable time, which suggests a confluence bullish signal.
Based on the outlook, a bullish continuation with an H1 candle above the 2398.00 level would validate the bullish continuation, following the major trend.
On the other hand, a failure to hold the price above the high volume line with a bearish H1 close below the dynamic weekly VWAP line could lower the price toward the 2324.47 support level.
Based on the current market outlook, the XAUUSD price looks like it has potential for bulls, where a trend continuation opportunity is highly possible. Investors should watch the intraday price, from where a bullish breakout could resume the major trend.