Published: April 11th, 2024
The WD-40 organization sustains a gradual yet consistent increase in sales. The company's revenue growth trajectory exhibits resilience due to prolonged domestic demand and significant opportunities for international expansion. Furthermore, its capacity to implement pricing strategies amplifies its source of income.
WDFC reported fiscal Q2 sales of $139.1 million, representing a 7% growth compared to the corresponding period in the prior year. Although it fell marginally short of analysts' projection of $140.0 million, this amount deviated from consensus by $1.15 million. It is worth mentioning that fiscal Q2 net sales increased across all regions, with the Americas accounting for 46%.
Sales experienced a slight 1% surge in the Americas, whereas significant expansion was observed in the United States and Latin America. On the other hand, EIMEA demonstrated a substantial expansion of 16%, driven by well-planned pricing and promotional strategies that were especially fruitful in France, India, and Iberia.
WD-40 has consistently progressed towards its long-term gross margin objective of 55%, attaining a fiscal Q2 gross margin of 52.4% in contrast to the 50.8% recorded the previous year. This improvement is the result of cost management and pricing strategies, including acquiring a distributor in Brazil.
In conjunction with projected 6-12% net sales growth and enhanced margins, overall EPS for the fiscal year is anticipated to increase.
Let's see the future price of this stock from the WDFC technical analysis:
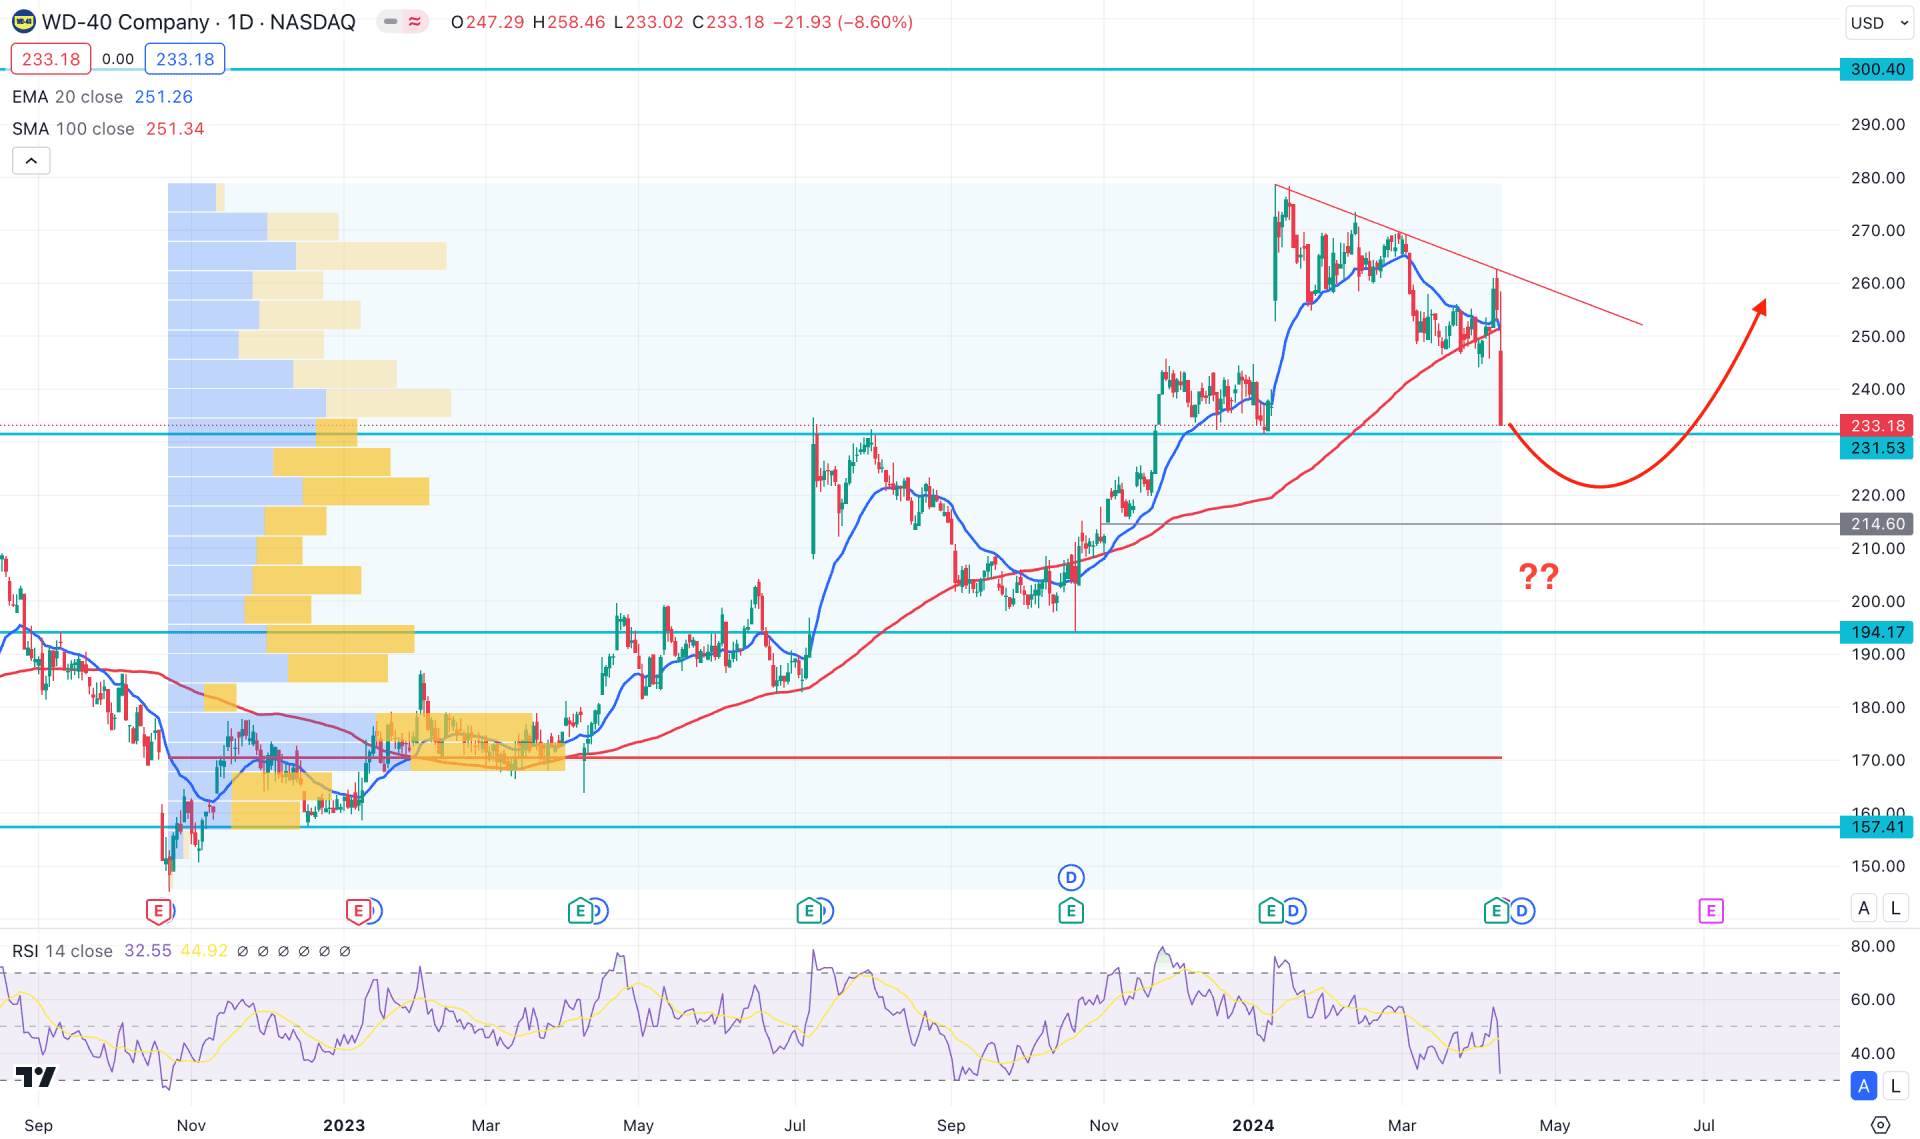
In the daily chart, the WDFC is trading with selling pressure as soon as the Q2 earnings report came with a lower-than-expected profit. As a result, the stock dipped down by 6% in a day, suggesting a possible counter-impulsive bearish pressure.
In the weekly chart, selling pressure is visible below the 20-week EMA, while the 100-day SMA is still below the current price. Moreover, the bearish two-bar reversal in the monthly chart supports the ongoing bearish pressure, which could work as a confluence bearish signal in this stock.
Looking at the volume structure, the most significant level since November 2022 is at 170.32 level, which is way below the current price. However, the ongoing selling pressure failed to form with a larger volume level, which suggests a possible bearish corrective structure. As per the current context, a bullish reversal is possible as long as the current price hovers above the 170.00 level.
In the daily chart, a strong bearish daily candle is visible below the 20-day EMA, which could be the primary sign of a bearish reversal. However, the current price remains above the 231.53 static event level, which could limit the downside pressure at any time.
Based on the daily market outlook of WDFC, the downside pressure might extend in the coming days, where a daily candle below the 230.00 level could lower the price toward the 194.17 support level.
On the other hand, any immediate bullish pressure with a trendline breakout could be a high probable long signal. Particularly, a daily close above the 265.00 level could increase the price towards the 300.00 psychological line.
Another long opportunity might come after completing the downside correction. In that case, a valid bullish reversal from the 220.00 to 194.70 zone with a daily close above the dynamic 20 DMA could resume the buying pressure above the 230.00 area.
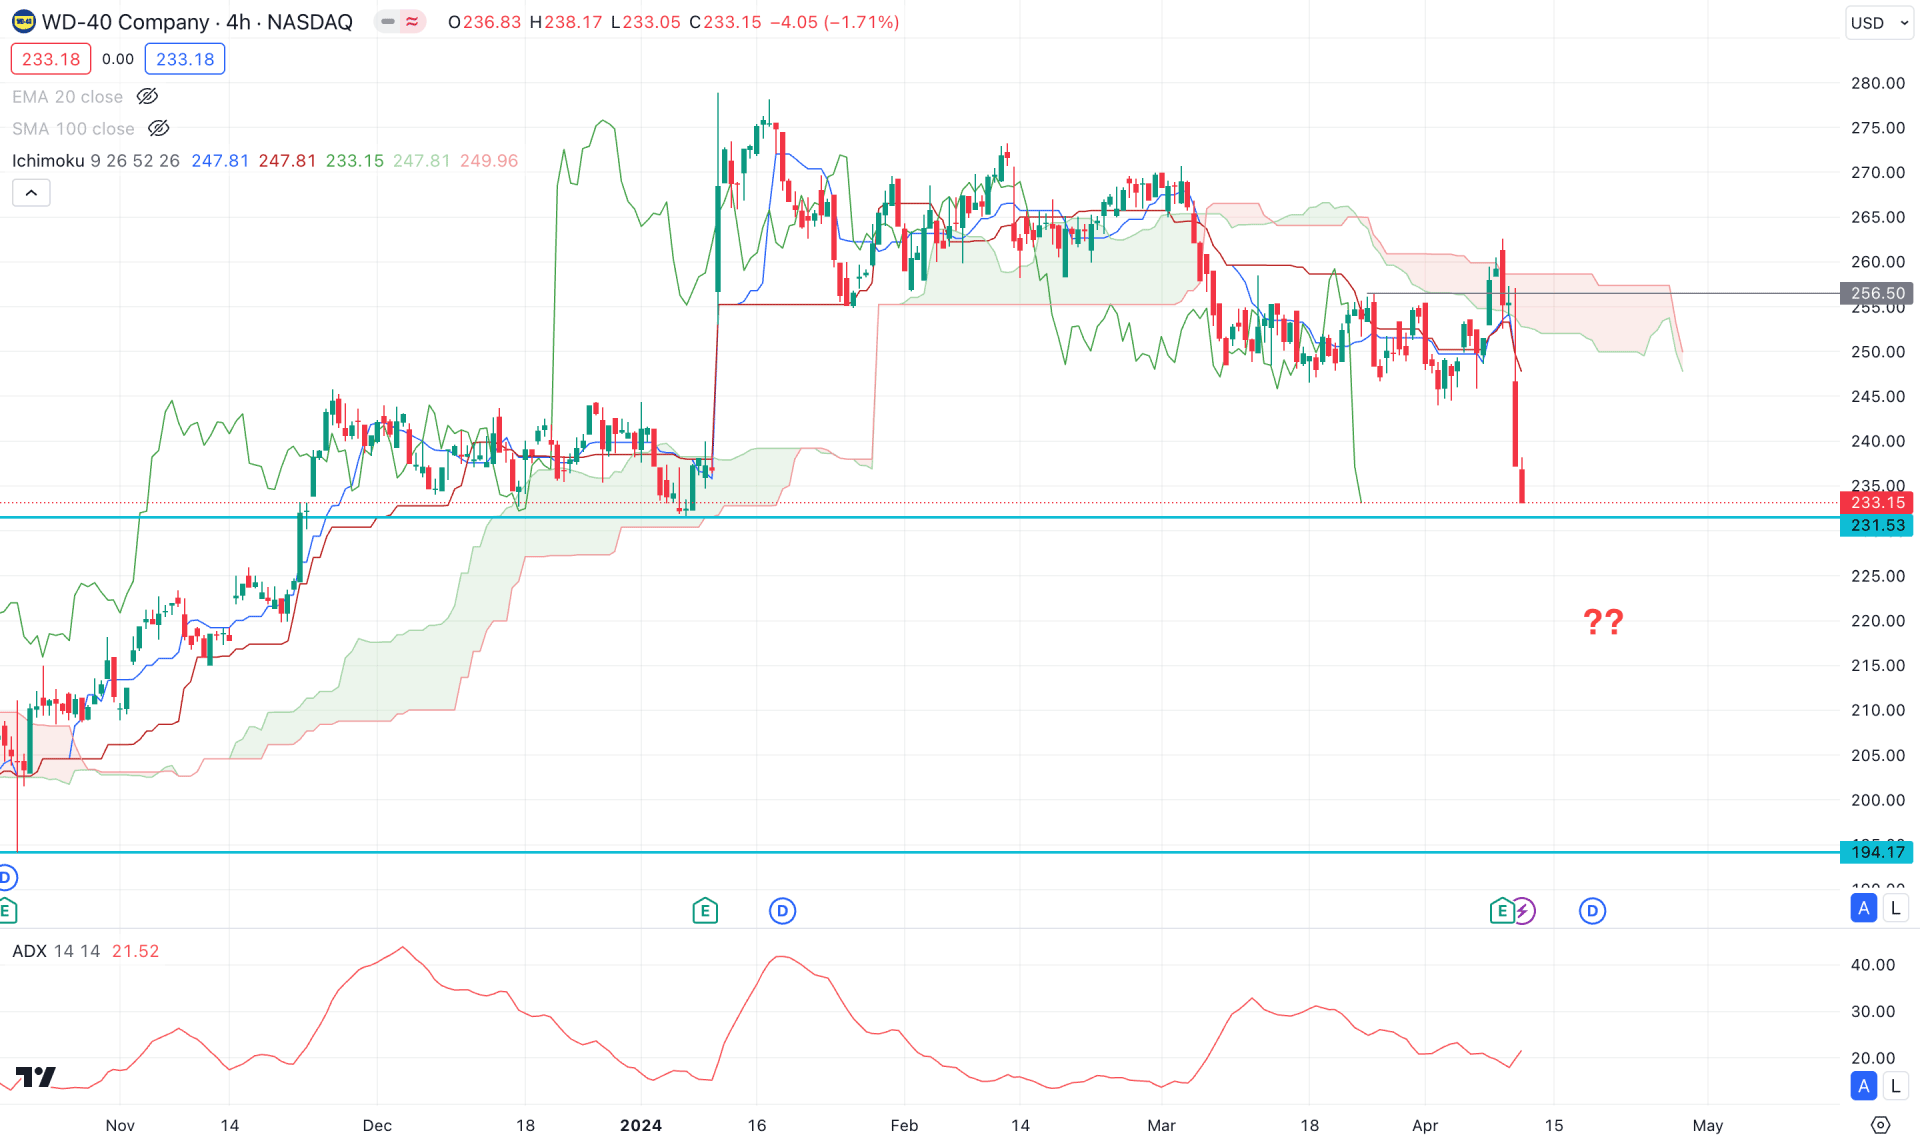
In the H4 timeframe, ongoing downside momentum is present below the Ichimoku Cloud zone. In the future cloud, the Senkou Span A turned below the Senkou Span B level, suggesting a bearish trend.
In the indicator window, the Average Directional Index (ADX) shows a rebound from the 20.00 level, which indicates a solid trend in the main price.
Based on the H4 structure, investors might find a bearish continuation signal after having a valid bearish rejection from the dynamic Kijun Sen level. Any H4 close below the 231.00 level could lower the price towards the 200.00 psychological level.
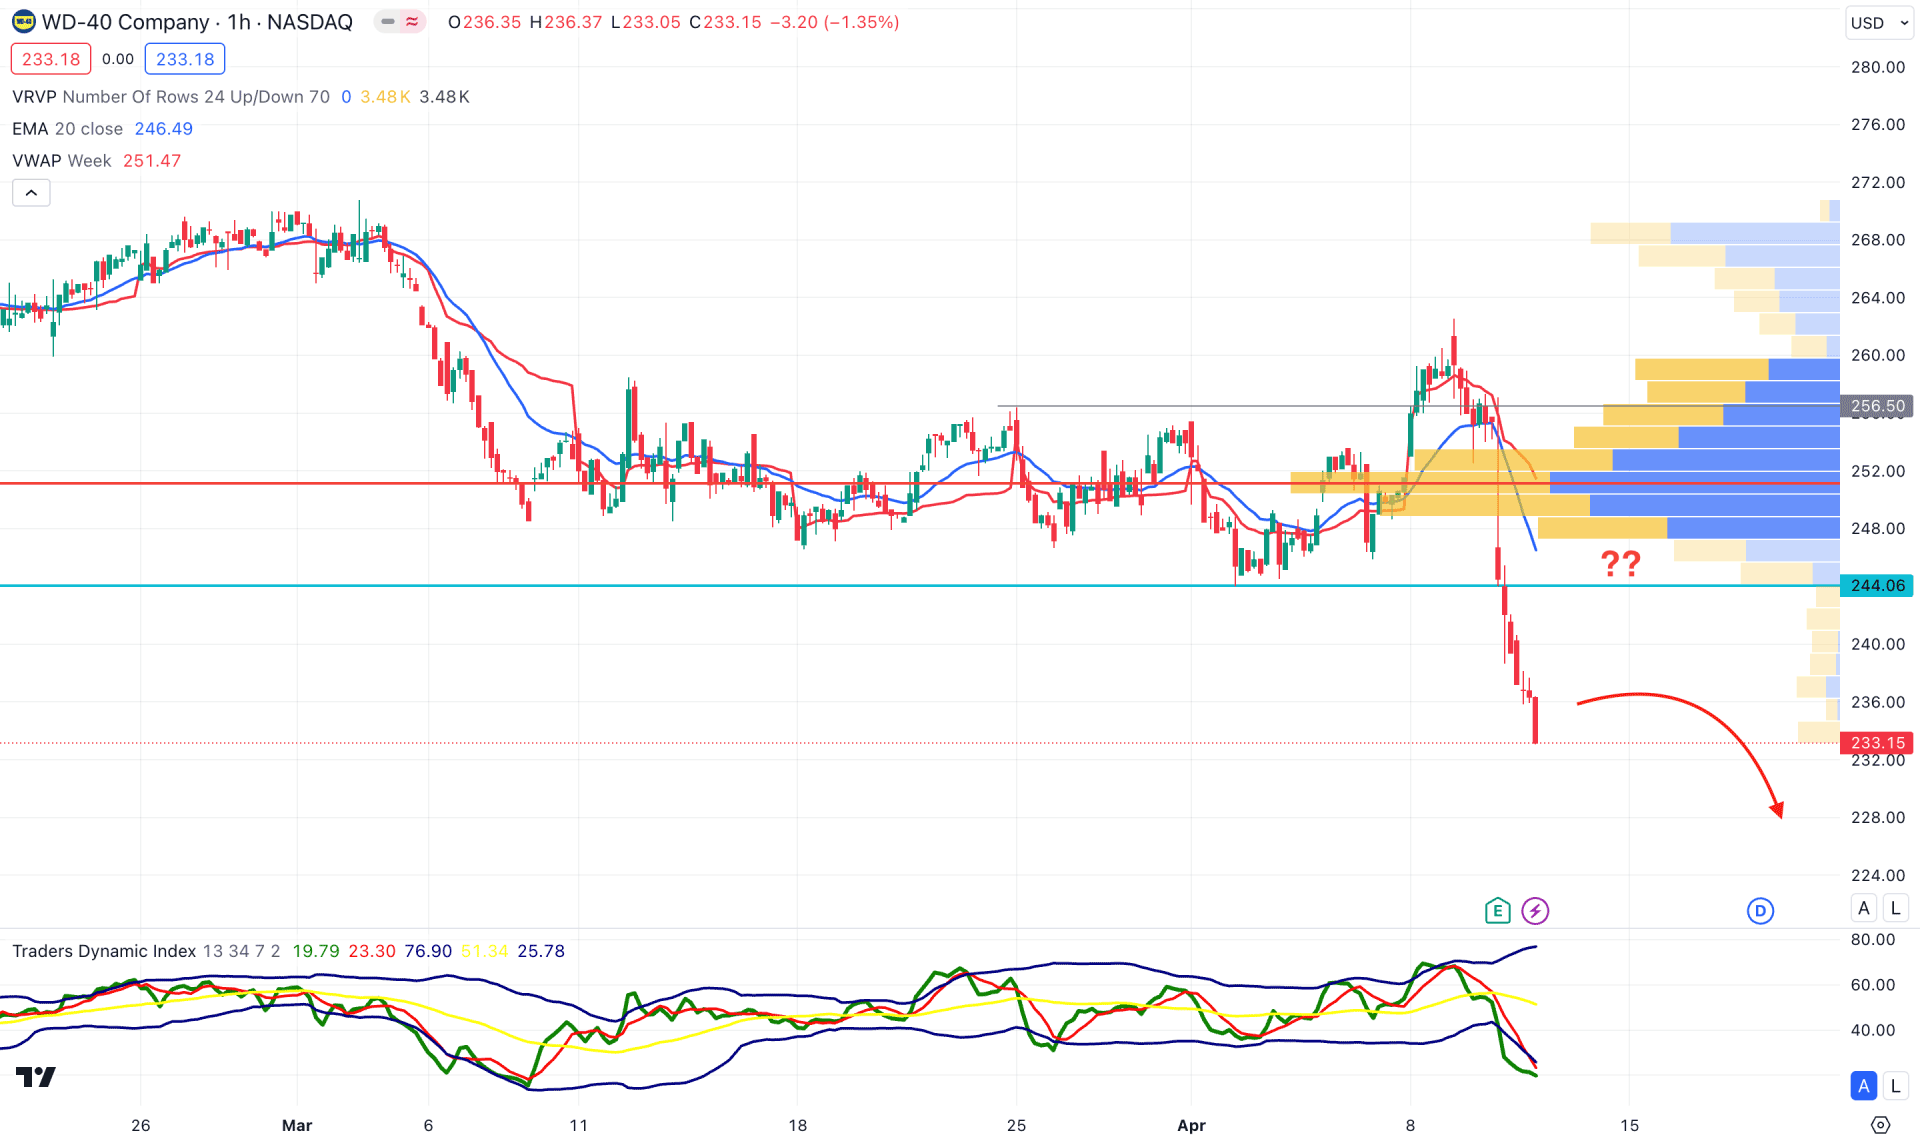
In the H1 chart, ongoing selling pressure is present as the recent downside momentum is solid below the visible range high volume level.
Moreover the downside pressure came with a valid buy-side liquidity sweep at the 256.60 level, which could work as an additional bearish signal for this instrument. The Traders Dynamic Index shows the same signal, where the most recent line found an extreme level from the lower band.
Based on this structure, a downside continuation is potent, but it needs a sufficient bullish correction as a mean reversion. However, the 256.50 level would be the ultimate level for bears as a bullish H4 candle above this line could eliminate the downside possibility.
Based on the current multi timeframe analysis, WDFC stock has a higher possibility of moving down. However, no significant high volume level is formed at the top, which results in a bullish continuation anytime after forming a bullish liquidity sweep from near term support levels.