
Published: May 2nd, 2024
The notable fluctuation in USDJPY price occurred amid a period of stagnant trading sentiment subsequent to Wall Street's shutdown and shortly after the culmination of the U.S. Federal Reserve's policy meeting. As Federal Reserve Chair Jerome Powell reaffirmed the institution's inclination towards easing interest rates, the dollar had already weakened. However, Powell emphasized that interest rate adjustments could be delayed due to persistent inflation.
The Bank of Japan has advised against further policy tightening since its initial rate hike in March, the first since 2007. This is despite the dollar's year-long ascent of over 10% against the yen, which has been fueled by traders adjusting their expectations regarding the timing of the first Fed rate cut.
Official data attributes the notable reversal, which occurred on Monday, to Japanese intervention amounting to approximately $35 billion. According to Takatoshi Ito, a former finance ministry executive and Columbia University academic, the MOF probably intervened in currency markets on Thursday to communicate its position, with 160 yen per dollar serving as a critical threshold.
Let’s see the further aspect of this pair from the USDJPY technical analysis:
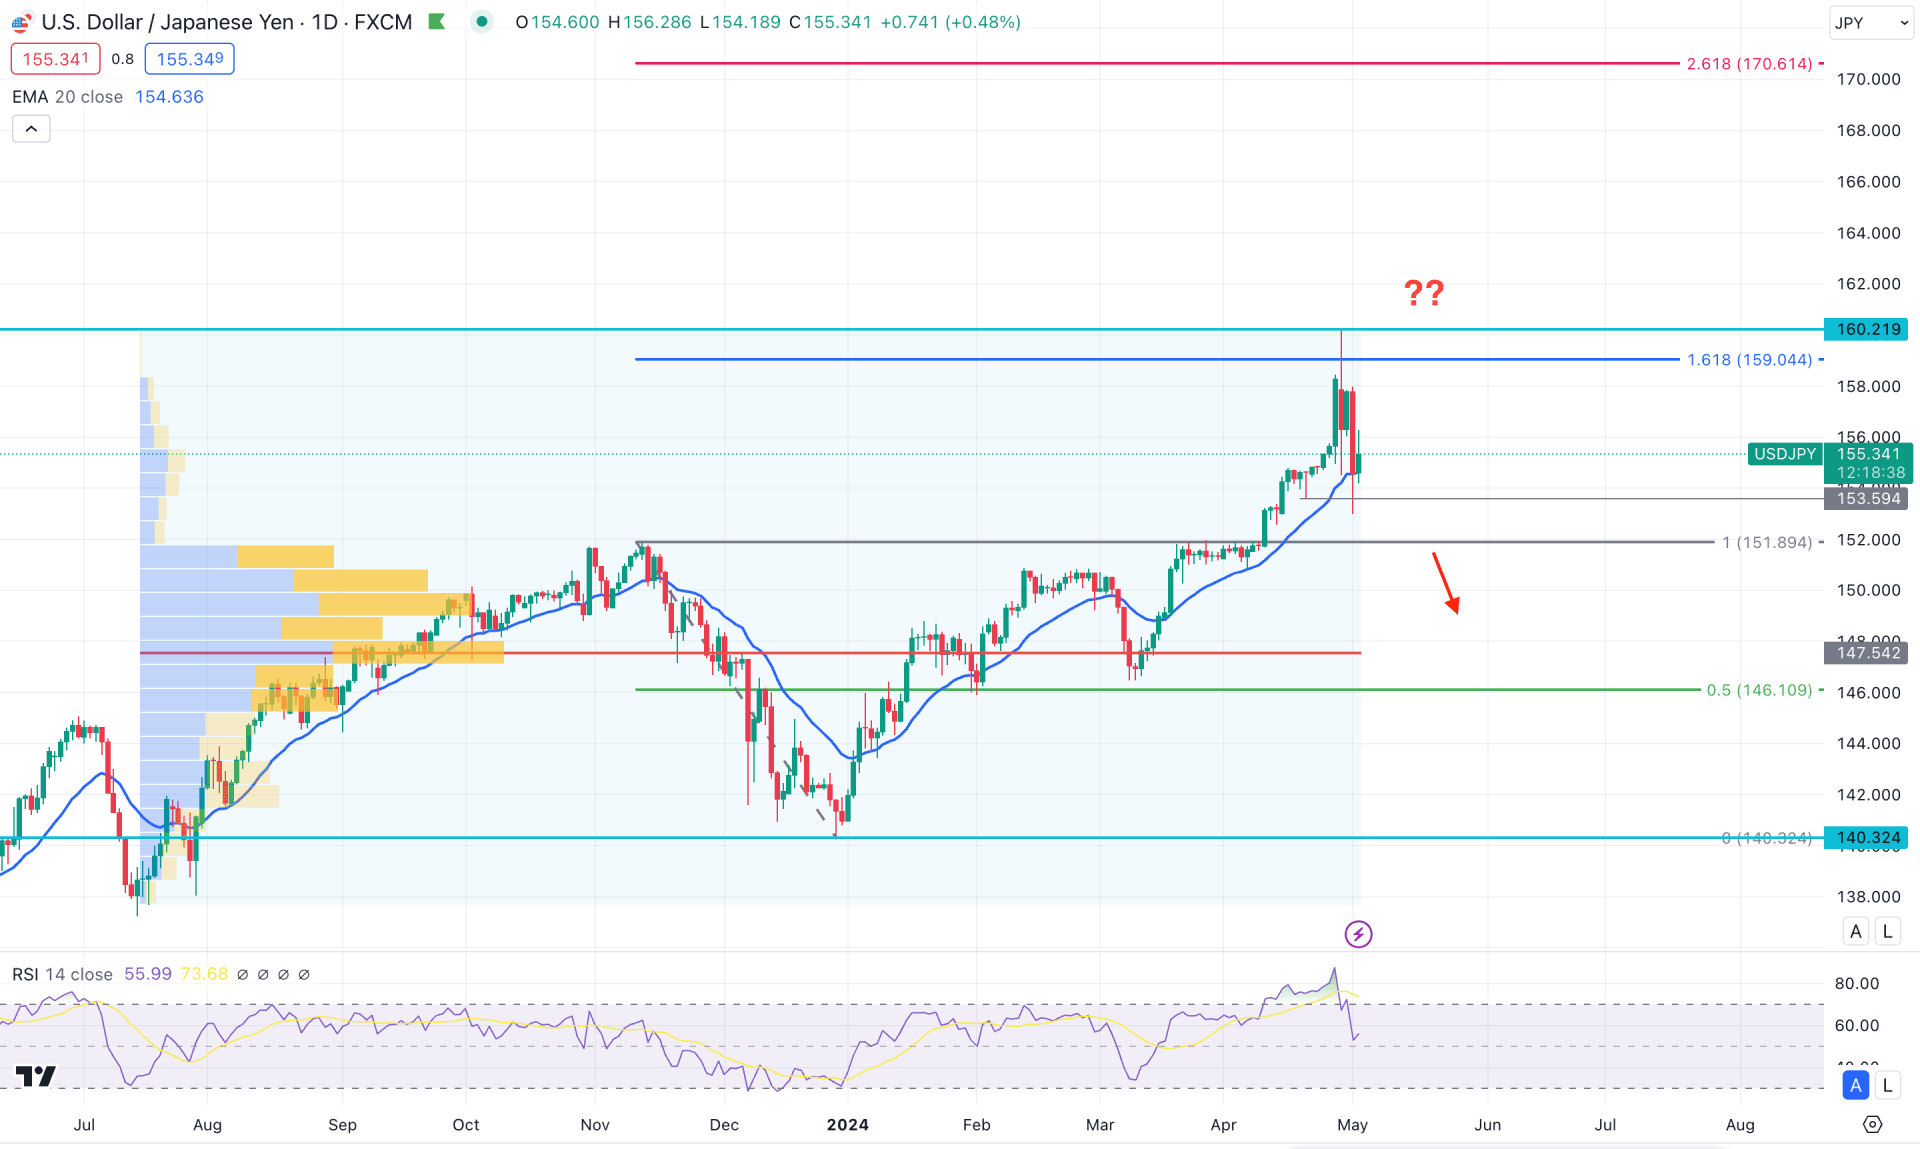
In the daily chart of USDJPY, the overall market momentum is bullish, where the current price hovers above the dynamic 20 day EMA support. However, the immediate buying pressure and an exhaustion at the top could work as a strong bearish reversal opportunity, depending on the price action.
In the higher timeframe, the ongoing buying pressure is valid as the current monthly candle still trades within the bullish body formed in April 2024. Moreover, the weekly price suggests a different story as the current candle trades bearish after sweeping liquidity from the 158.38 swing high. In this context, a bearish reversal is possible, but a clear picture of the daily price action is needed.
In the volume structure, the highest trading activity level since July 2023 was formed at 147.54 level, which is below the current price. Although the price formed an exhaustion at the 158.00 high, no significant high volume level is seen nearby.
In the main price chart, the ongoing buying pressure found a ceiling at the 161.8% Fibonacci Extension level, from where a massive bearish daily candle formed. However, the near-term support level of 153.59 is still protected, which could be a barrier to sellers.
In the secondary indicator window, the Relative Strength Index (RSI) reached the highest level of 87.24 and moved below the 60.00 zone. In that case, more downside pressure with the RSI below the 50.00 line could be a potential bearish signal.
Based on the daily outlook of USDJPY, a bearish trend reversal needs a stable market below the 153.59 support level, which might lower the price toward the 150.00 psychological level. The alternative trading approach is to look for long trades after having a solid bullish recovery from the dynamic 20-day Exponential Moving Average. In that case, the upward momentum might continue above the 160.00 psychological level.
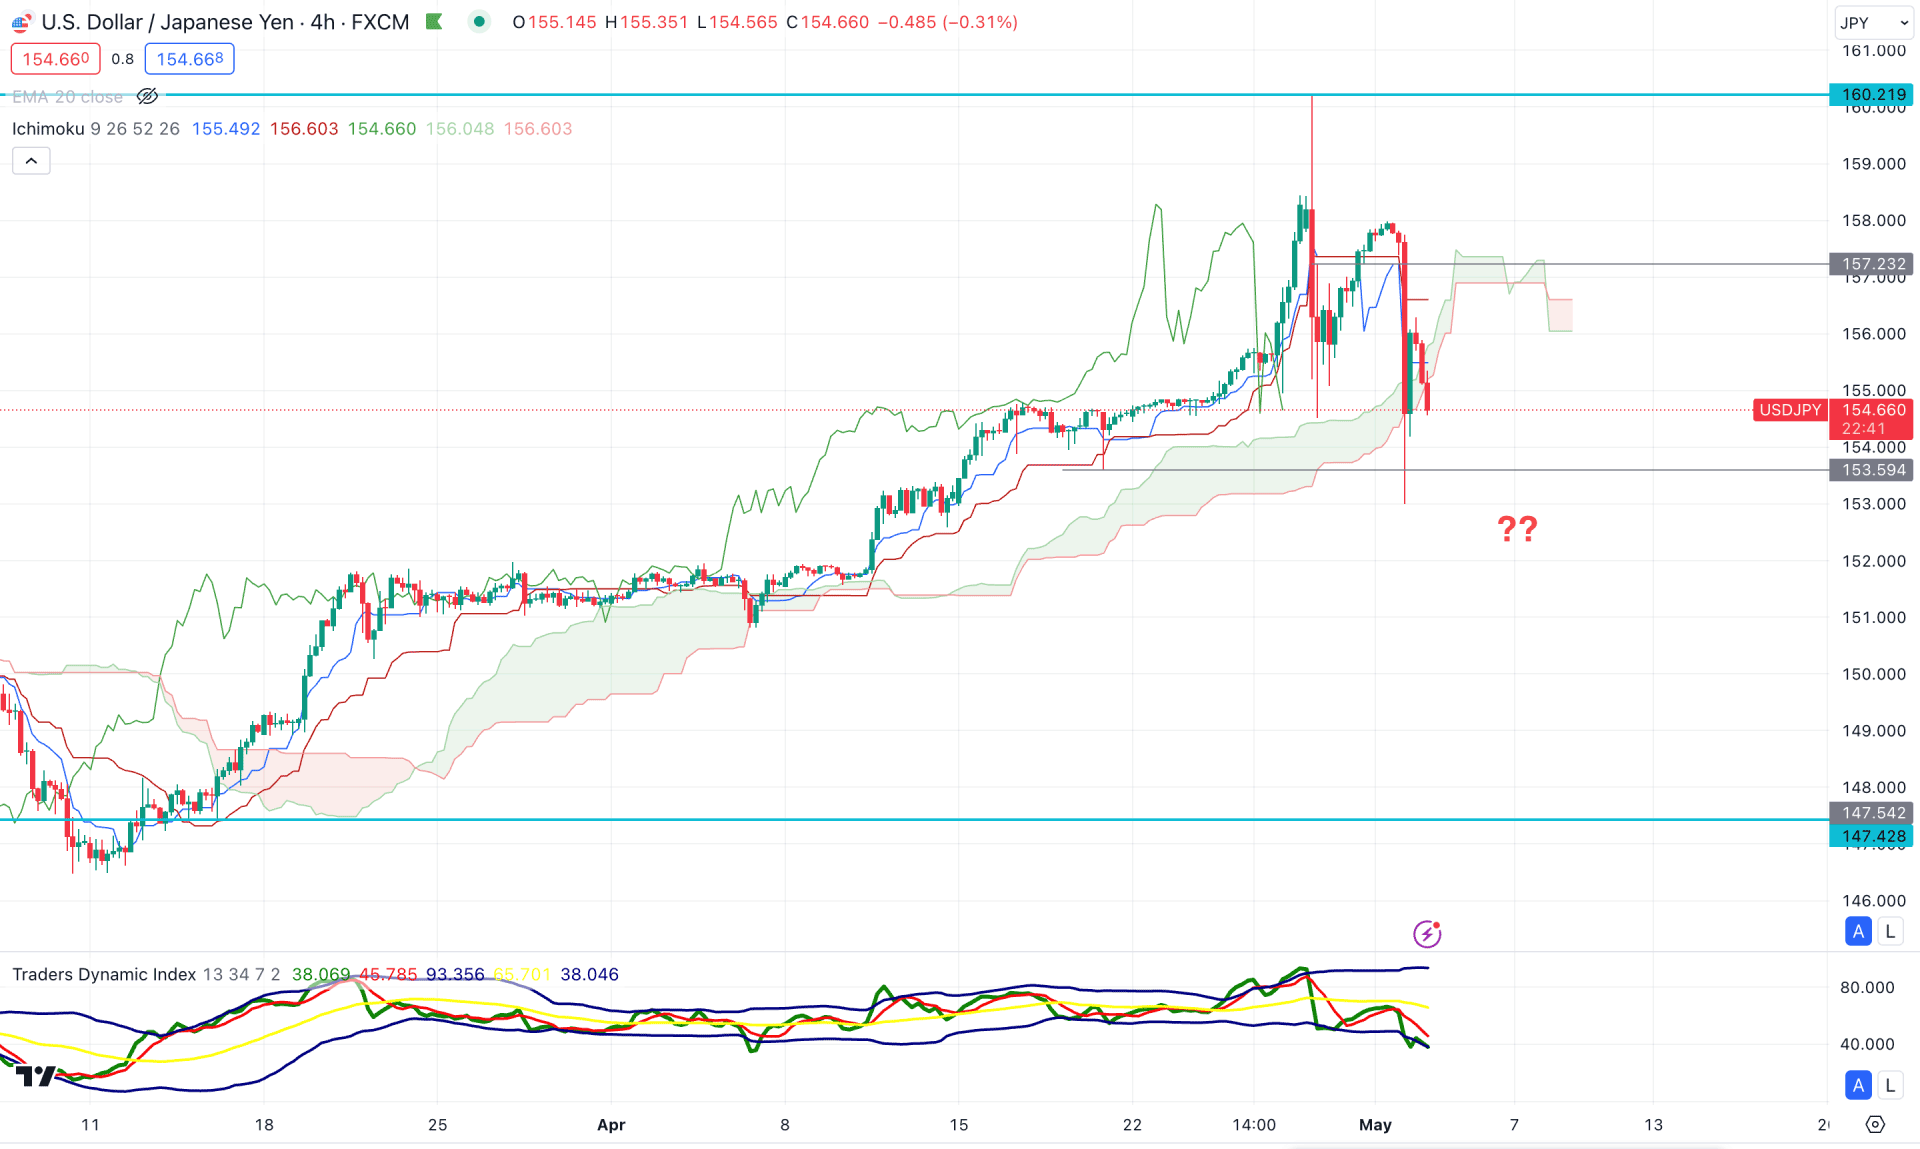
In the H4 timeframe, the overall market structure is volatile, where the recent upward pressure above the 158.00 level with an immediate recovery could be a sign of a trend reversal.
In the most recent price, bearish price action is visible below the Ichimoku Cloud zone, while the Senkou Span A aimed lower in the future cloud. The Visible range high volume level shows a similar structure, as the current price is below the 50.00 neutral zone with a downward slope.
Based on the H4 outlook of USDJPYY, a bearish trend reversal needs another swing low below the 153.59 level before creating a short-term bearish pressure towards the 148.00 level.
The alternative trading approach is to look for a bullish reversal above the Ichimoku Cloud with an H4 close. In that case, a long opportunity might open, targeting the 160.00 level.
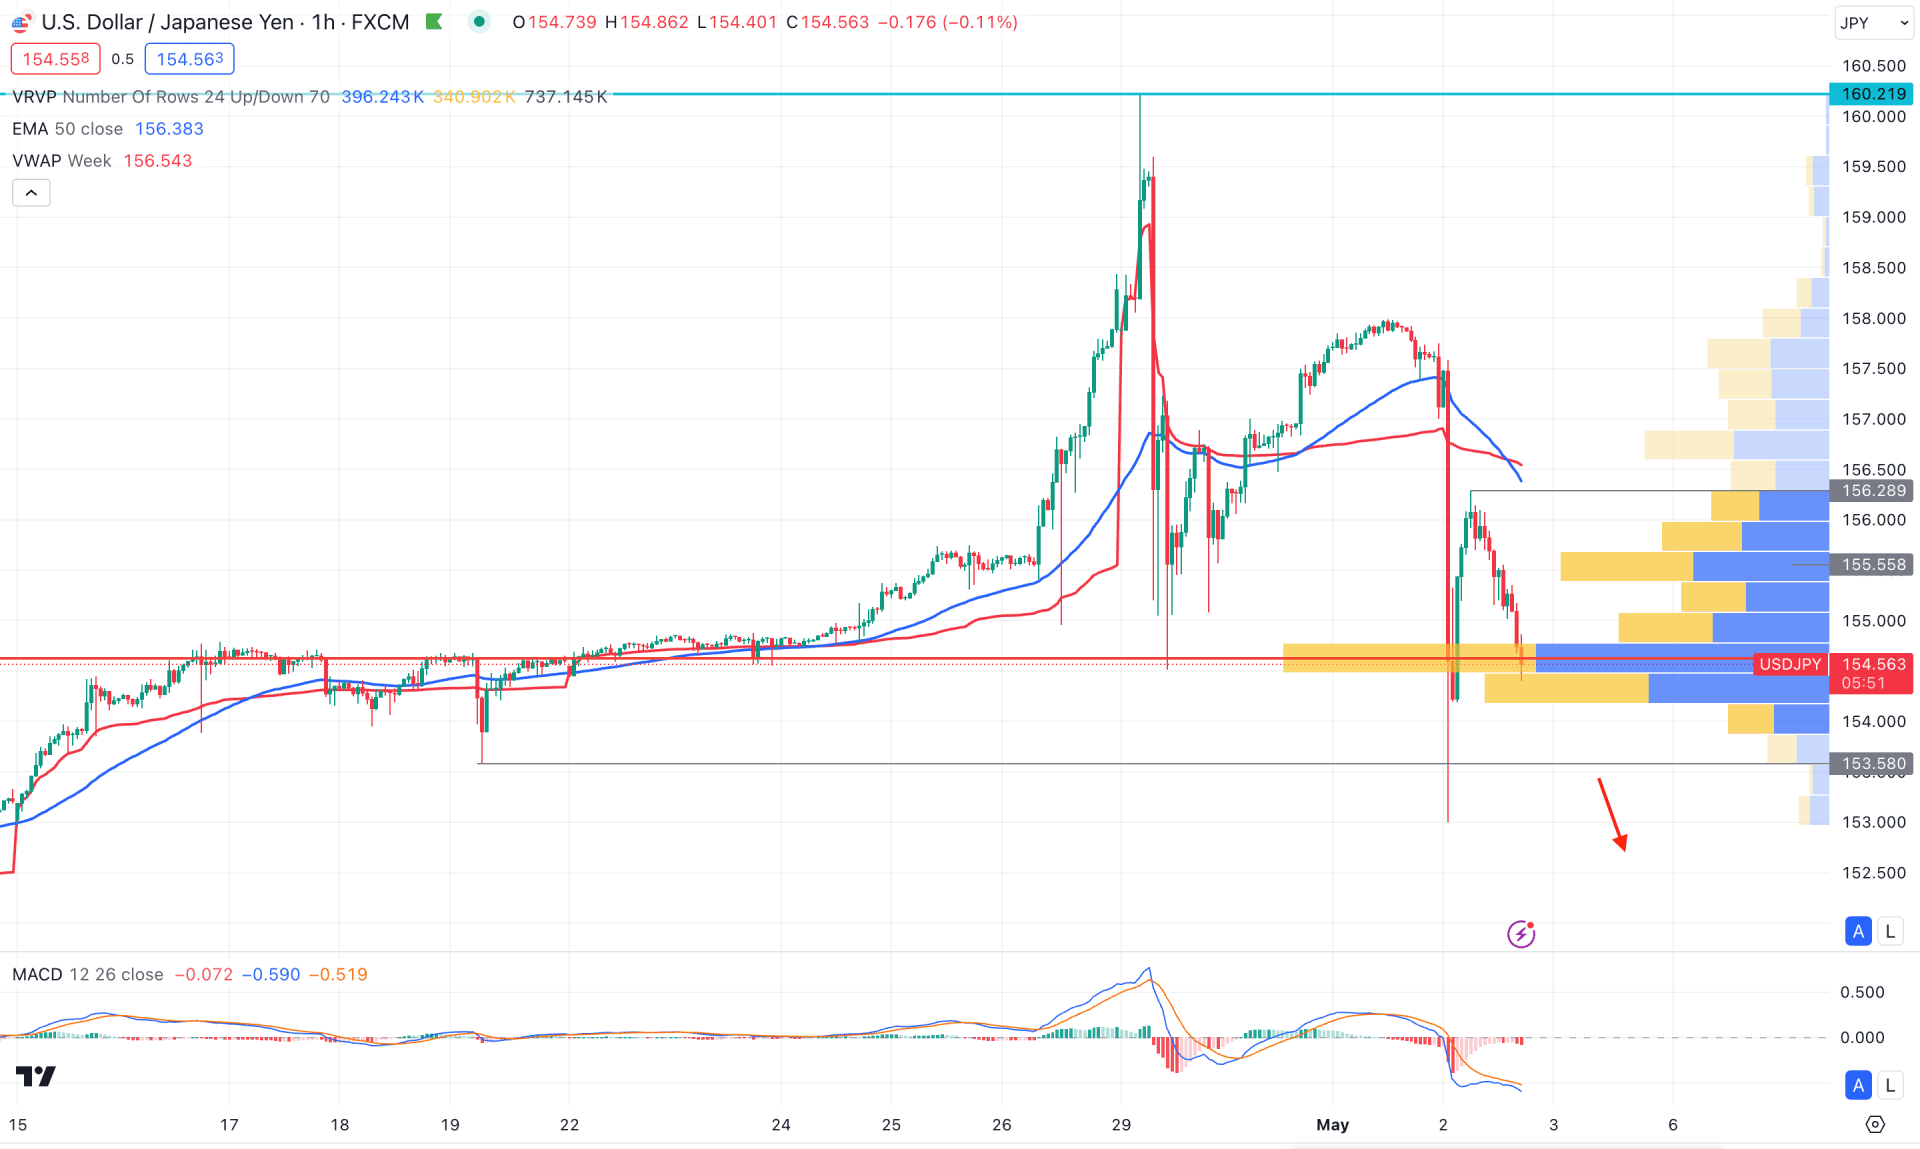
In the H1 chart, the broader market direction is bearish, although the current price hovers above the visible range of the high volume level. Moreover, the 50 EMA is above the 156.28 swing high with a bearish crossover with the dynamic weekly VWAP.
Based on the hourly structure, the downside continuation might come after having a solid hourly candle below the visible range of a high volume level. In that case, a bearish H1 candle below the 153.00 level would be a high probability of a short opportunity, targeting the 148.00 area.
On the other hand, an immediate bullish recovery is possible, where an hourly candle above the 156.28 level could resume the existing trend.
Based on the current market outlook for USDJPY, a new swing low in the intraday chart could be the first sign of bearish pressure. Investors should closely monitor how the price reacts to the near-term level to find the high probable trading opportunity.