Published: April 30th, 2024
The beginning of the fourth quarter has proven difficult for various cryptocurrency tokens, including Tron (TRX). Legal disputes have historically posed a substantial obstacle for numerous cryptocurrency ventures. In the end, what matters is how founders effectively overcome these challenges. The token has encountered legal obstacles amid deliberations among Tron (TRX) users regarding worldwide proliferation.
At this time, Tron (TRX) is embroiled in intricate legal proceedings under the jurisdiction of the United States of America, much like previous instances involving Ripple (XRP). Although stakeholders are concerned that this legal dispute could disrupt trading, they maintain optimism regarding the successful resolution of Tron (TRX).
Tron (TRX) has established itself as a formidable alternative currency in cryptocurrencies. Under Justin Sun's leadership, a decentralized internet is being advanced. Its infrastructure facilitates decentralized applications (dApps), and TRX functions as the fundamental currency for network transactions and operations.
Recent performance indicators for Tron (TRX) are favorable, as evidenced by its 7.04% weekly price increase above the 0.1000 psychological line. Concurrent with this momentum, there has been a significant 37.55% surge in trading volume during the previous twenty-four hours, which indicates an expansion of trust and attention in the TRX market.
Let's see the further aspect of this coin from the TRX/USDT technical analysis:
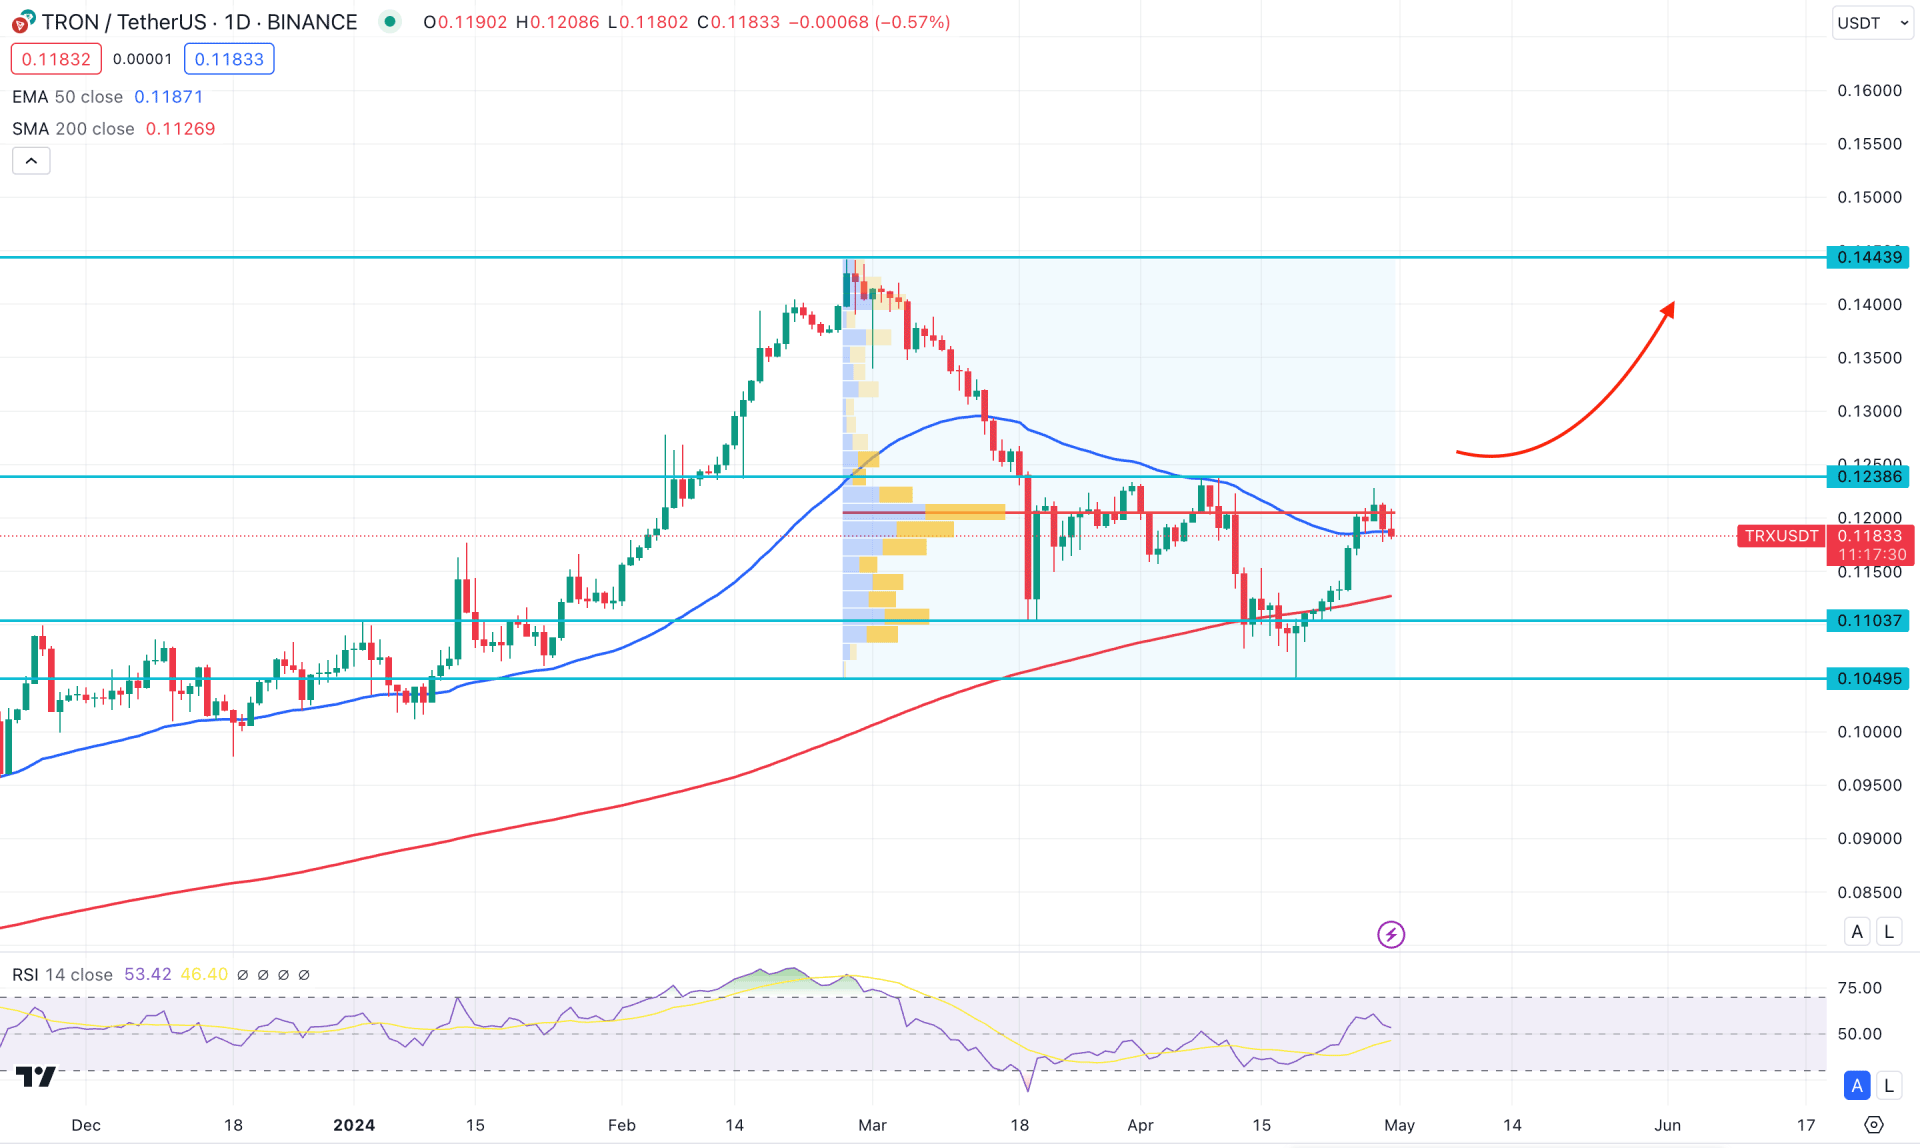
In the daily chart of TRX/USDT, the broader market context is bullish, where the current price hovers at the dynamic 50-day EMA line. Moreover, the price found a peak at the 0.1443 resistance and showed a decent recovery to the 0.1103 line. Later on, an additional downside pressure below this line with an immediate recovery suggested a sell-side liquidity sweep. In this context, additional buying pressure with a bullish breakout could be a potential long signal, creating a long-term bull run.
In the long-term market outlook, the monthly candlestick suggests an ongoing bearish pressure from the inside bar formation, which needs a valid close to confirm the long-term trend. As the current price hovers within February's bullish candle, a successful close above the February low could be a potential long opportunity. Moreover, the weekly price indicates a potential bullish signal as the recent candle closed higher after forming a valid bearish rejection.
In the volume structure, the current high volume level since 15 February high is closer to the current price. It indicates that the price is trading within a liquidity zone, from where a bullish breakout could be a potential long signal.
In the daily chart, the recent recovery from the dynamic 200 day SMA line suggests a major bullish recovery. However, the 50 day EMA with the high volume line suggests a struggle to bulls. Meanwhile, the 14 day Relative Strength Index (RSI) remains above the 50.00 neutral level, suggesting a possible buying pressure.
Based on the daily market outlook of TRX/USDT, the upside movement needs a valid recovery from the re-accumulation phase. The recent sell-side liquidity sweep signaled a manipulation, which provided an early bullish signal.
The conservative trading approach is to look for a daily candle above the 0.1238 resistance level, which could open a long signal targeting the 0.1443 level.
On the other hand, the ongoing selling pressure from the 50 DEMA level is working as a bearish opportunity, which could lower the price towards the 0.0950 level.
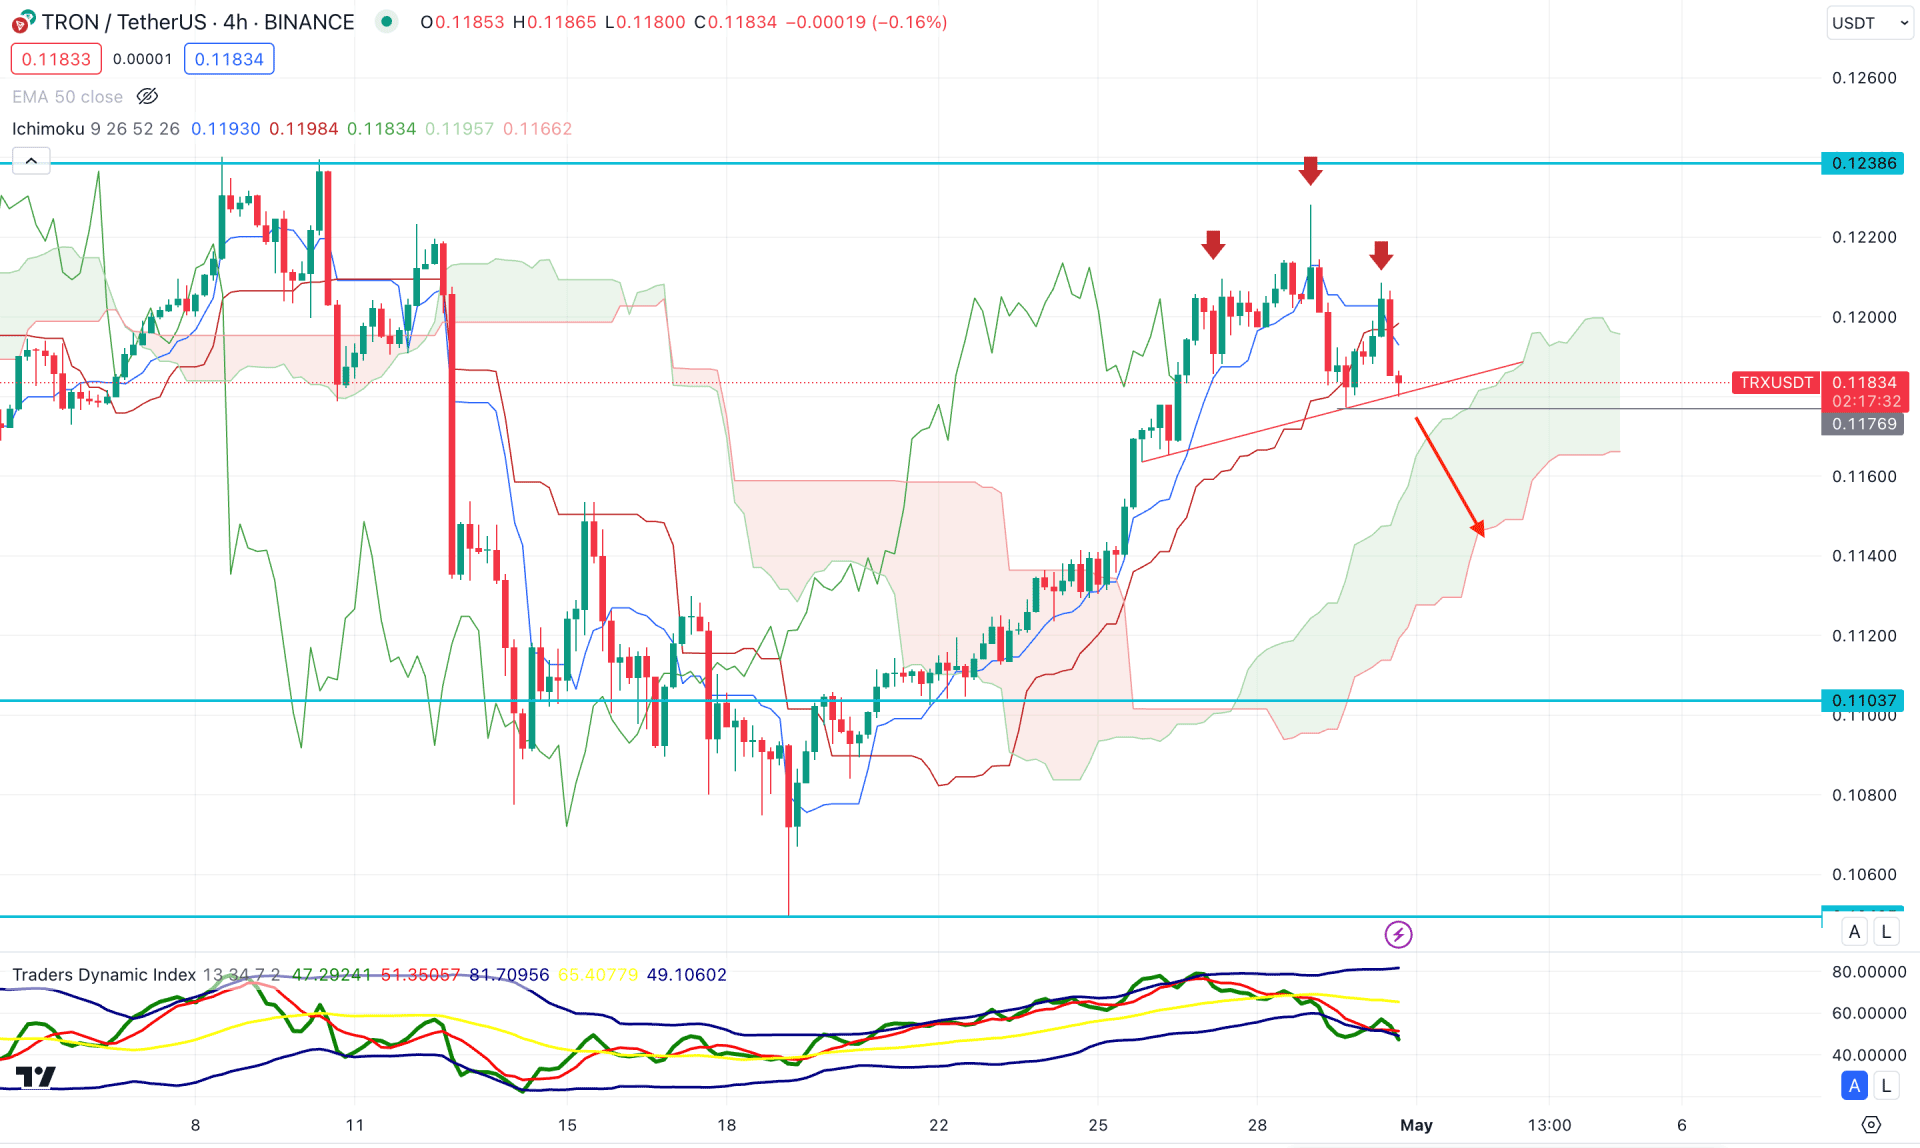
According to the Ichimoku Cloud analysis of the TRX/USDT H4 chart, the ongoing bullish pressure found a peak above the dynamic Kijun Sen level. Moreover, a potential Head and Shoulders pattern is visible at the Kijun Sen level, suggesting a potential bearish opportunity.
In the indicator window, the Traders Dynamic Index (TDI) reached the oversold point, indicating a potential bearish trend.
Based on the H4 structure, a bearish H4 candle below the 0.1176 static line could be a potential Head and Shoulders breakout. In that case, the price might extend the momentum and reach the 0.1120 static level in the coming hours.
On the other hand, an immediate bullish recovery above the Kijun Sen line could resume the existing trend, targeting the 0.1300 area.
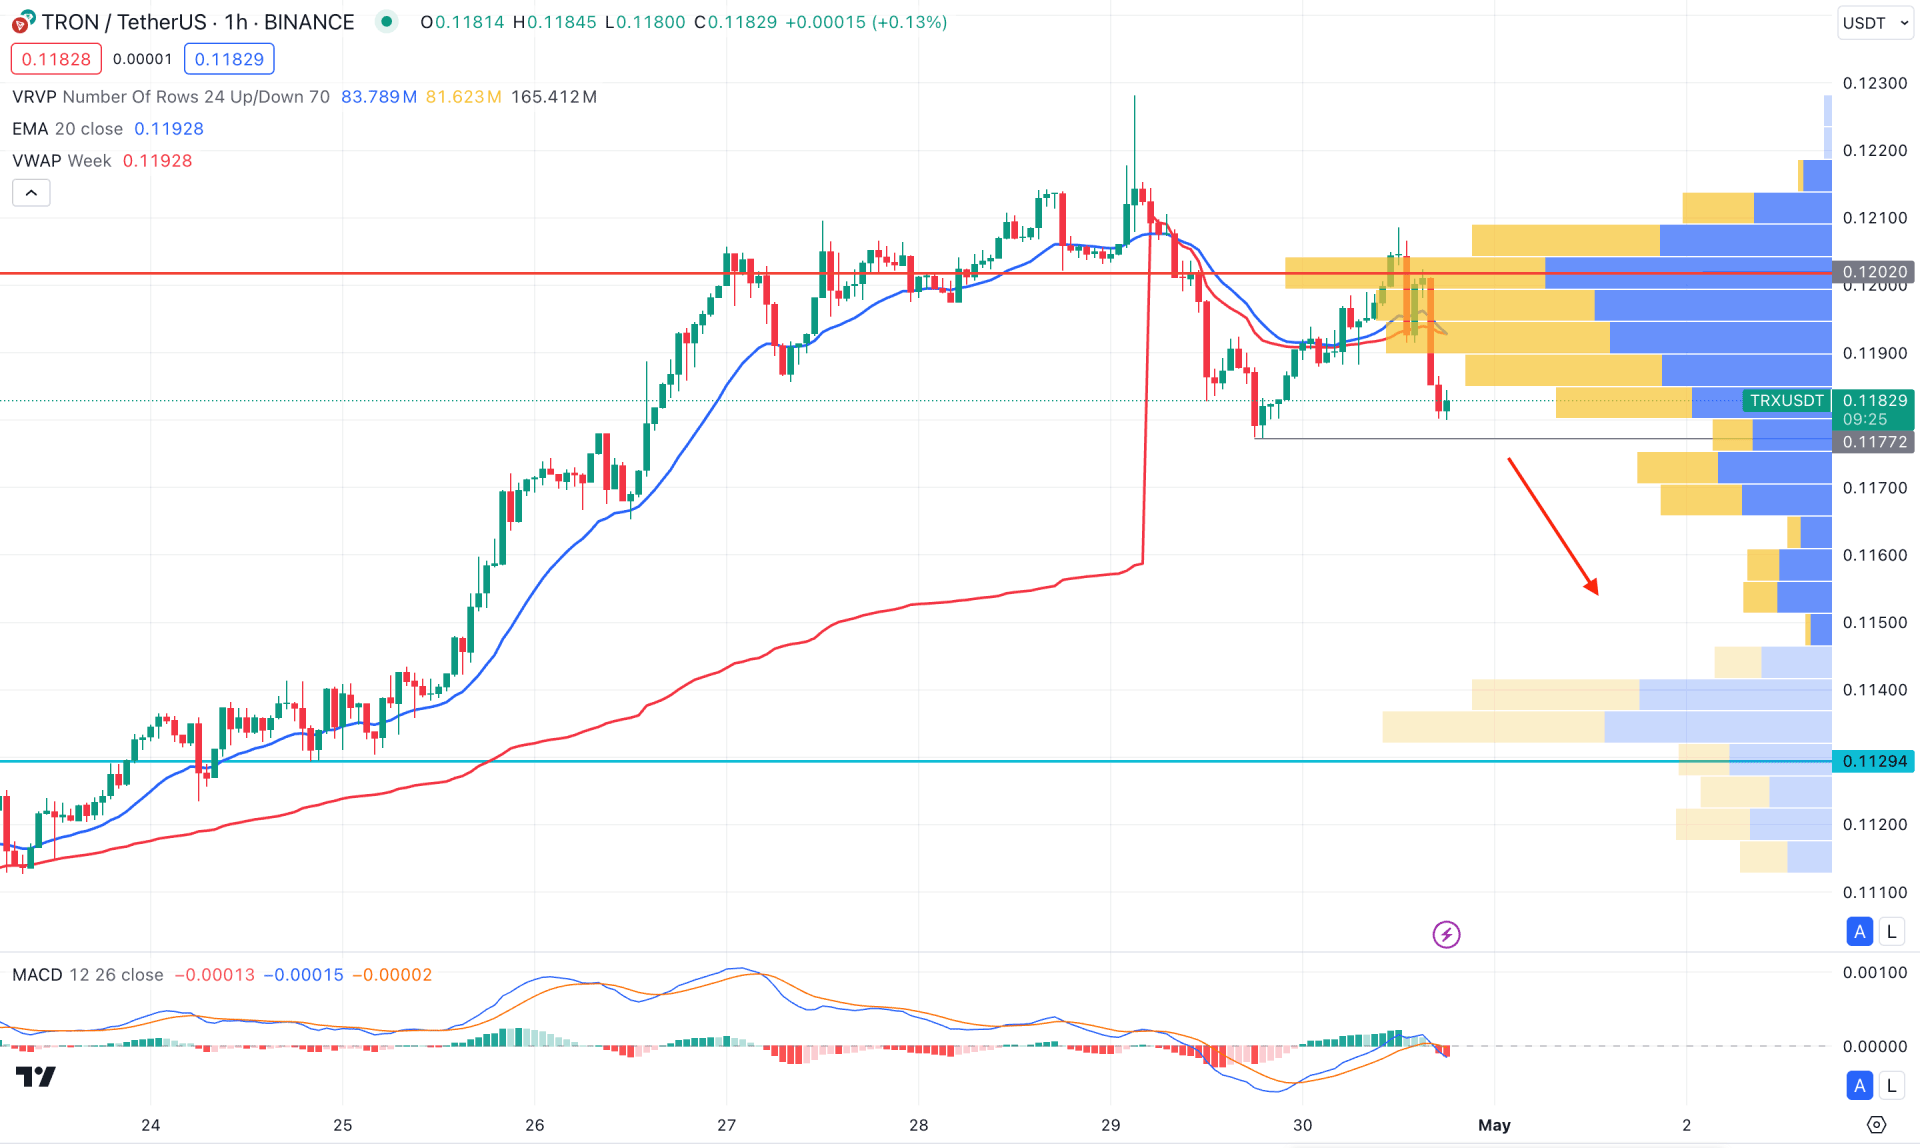
In the hourly time frame, the broader market direction is bearish as the current price hovers below the visible range of the high volume level. Moreover, a strong bearish H1 candle is present below the dynamic VWAP line, suggesting a confluence bearish signal.
In the secondary window, the downside pressure is potent as the MACD Histogram maintains the downward momentum for at least 2 hours. Moreover, the MACD Signal line formed a bearish crossover at the neutral zone, signaling a confluence bearish signal.
Based on the H1 structure, a bearish H1 candle below the 0.1177 low could be a potential short opportunity, targeting the 0.1129 support level. The alternative approach is to look for a bullish breakout above the 0.1202 level before anticipating a long move.
Based on the current market structure, TRX/USDT could resume the bullish trend after forming a successful bullish range breakout. Investors should closely monitor the daily price as a potential bullish signal might come after a valid daily close.