
Published: April 16th, 2024
The Ondo Finance token has experienced an extraordinary price surge, increasing by more than 90% over the past month despite the general bear market for cryptocurrencies. In anticipation of Bitcoin's April 20 halving, investors are eager to expand their portfolios beyond the leading cryptocurrency.
ONDO recently demonstrated its agility by enabling transactions between Circle's USDC stablecoin. Ondo Finance CEO Nathan Allman confirmed via Telegram that, by Etherscan data, an Ondo wallet on Ethereum exchanged $250,000 worth of BUIDL tokens for USDC, signifying an early demonstration of Circle's USDC-to-BUIDL feature.
After announcing this transaction, ONDO witnessed an 8% increase in attention before restraining its gains. In asset tokenization, BlackRock, a multinational financial corporation, generated significant attention by collaborating with Securitize to introduce the BlackRock USD Institutional Digital Liquidity Fund. Daily yield payments are provided to token holders of this fund, denominated in the Ethereum-based BUIDL token.
Let's see the upcoming price direction of this coin from the ONDO/USDT technical analysis:
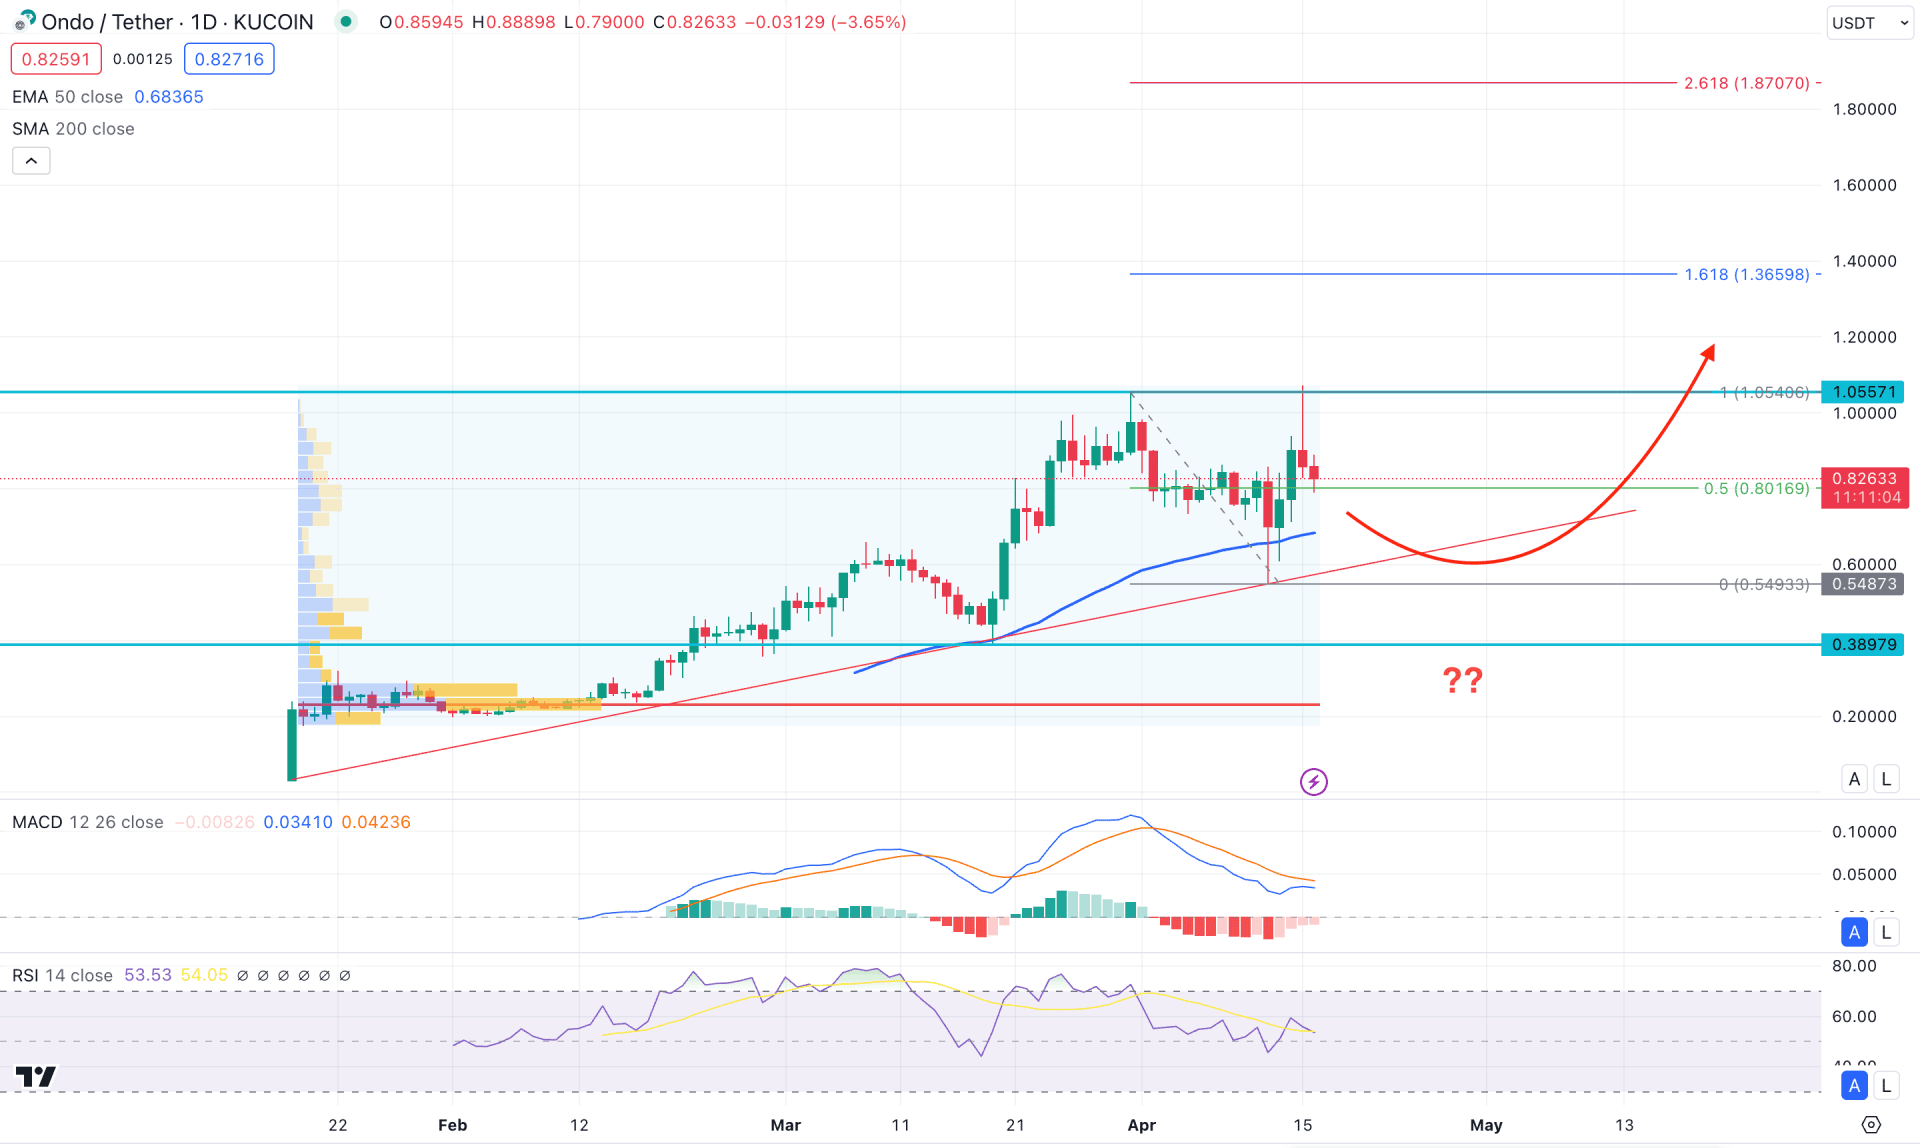
In the daily chart, the current buying pressure in ONDO/USDT is solid as the price moved higher, supported by the rising trendline support. Moreover, the most recent price shows a downside correction after making a new all-time high. Therefore, investors should closely monitor how the price reacts to the near-term support area from where bulls may regain momentum.
In the higher timeframe, the current weekly candle trades bearish after having a long wick upside. However, the last few candlesticks suggest an ongoing bullish trend, which may resume after having a long bottom.
In the volume structure, the highest volume level since the inception was the 0.2288 level, which is below the current price. Moreover, the price made a new all-time high this week, from where the downside correction came with no significant volume formation.
The 50-day Simple Moving Average is the immediate support line in the daily price, from which a bullish reversal candlestick came as a trend continuation signal. Moreover, the MACD Histogram remains below the neutral line but aimed higher to the positive side, signaling a corrective market pressure. The 14-day Relative Strength Index (RSI) shows the same story, where the current level hovers at the neutral 50.00 line.
Based on the daily market outlook of ONDO/USDT, a high probable bullish opportunity might come after having a sell-side liquidity sweep from the 0.5487 swing low. Investors should monitor how the price reacts on this crucial line before finding a high probable long signal. A potential bullish reversal from the 0.6000 to 0.3897 zone with a D1 candle above the 20-day EMA could be a trend trading signal, targeting the 1.4000 psychological line.
On the other hand, continued downside pressure with a daily close below the 0.3890 line could extend the momentum toward the 0.2000 line before forming a bullish signal.
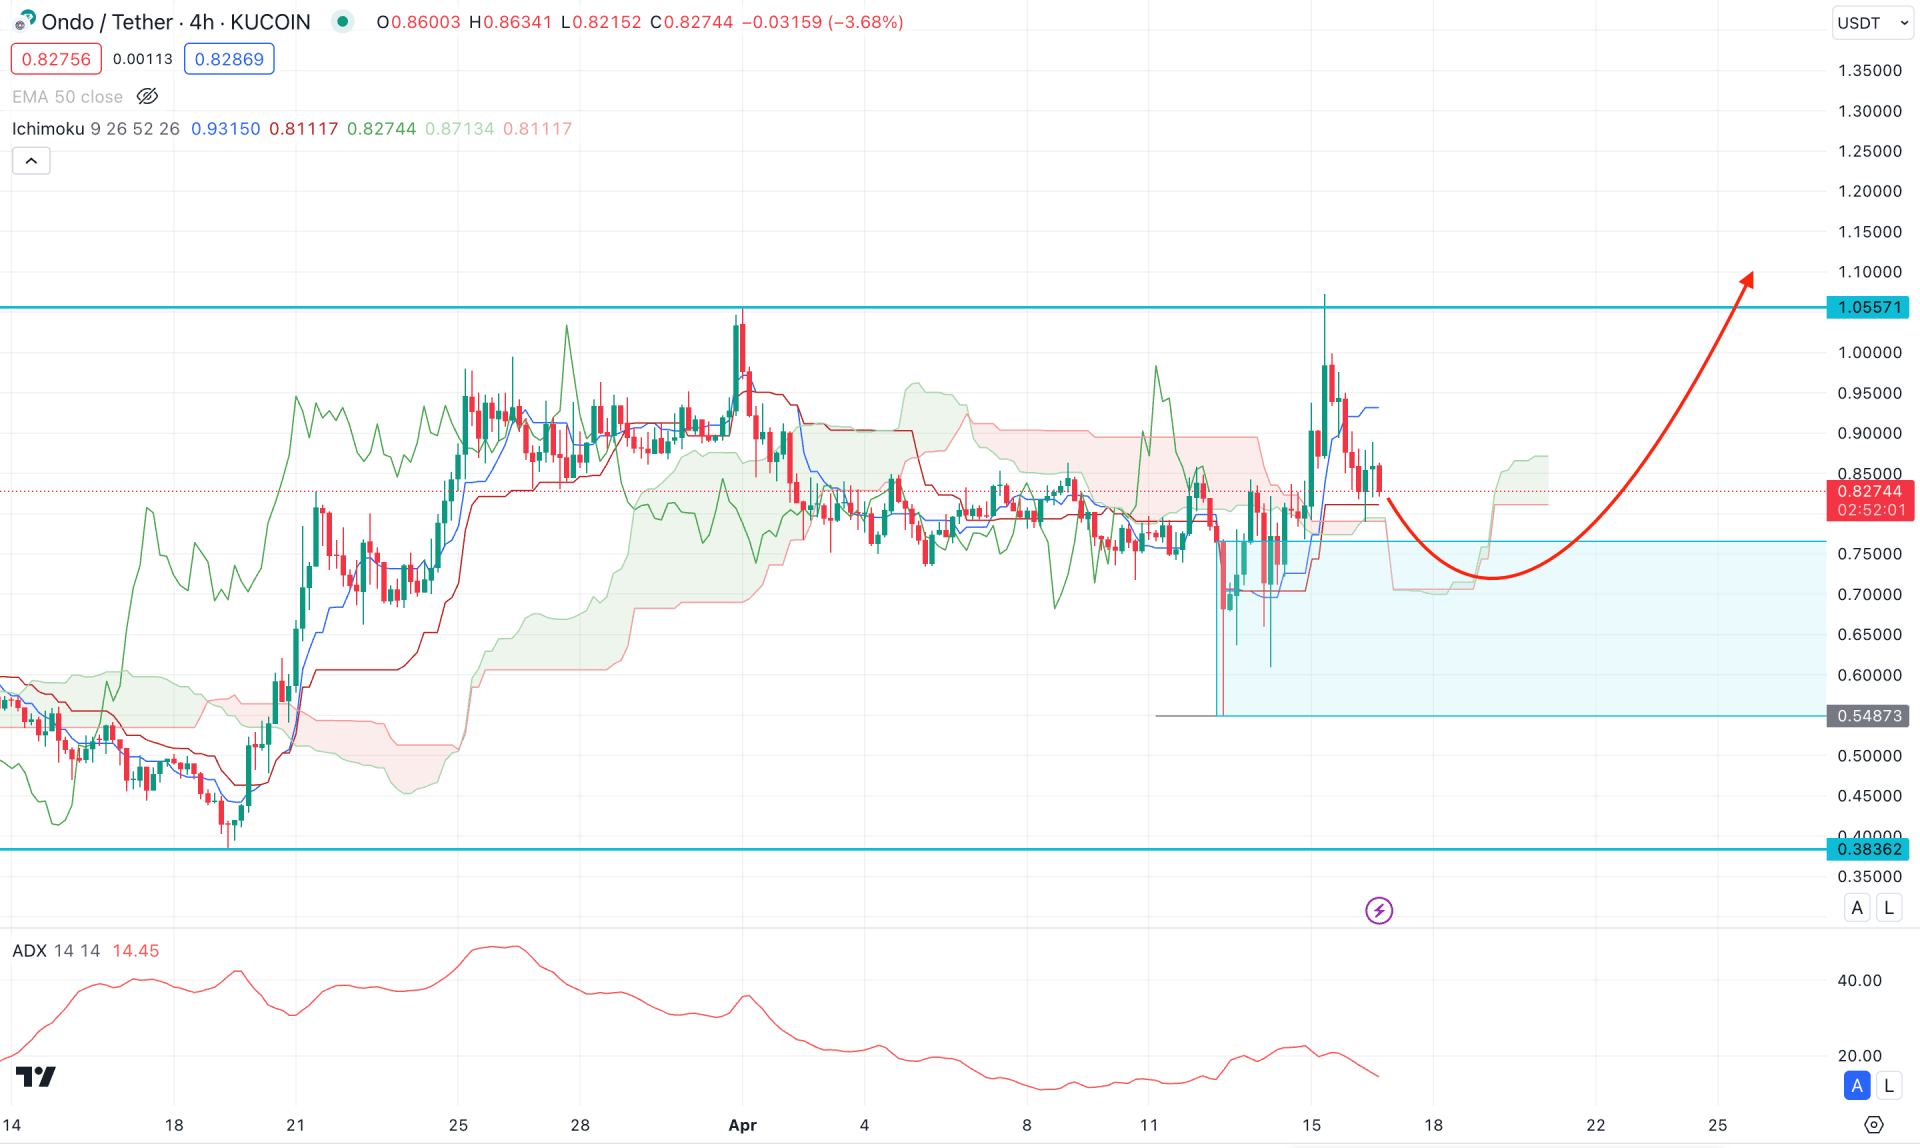
In the H4 timeframe, a bullish break of structure is visible at the 1.0557 resistance level from where a bearish reversal is seen with an exhaustion formation.
In the future cloud, the current Senkou Span A is above the Senkou Span B, while the Senkou Span B remains flat. This is a sign that the medium-term market trend is neutral while the short-term market trend is bullish.
In the indicator window, the current bullish order block is visible at the 0.5487 to 0.7660 zone, from where a bullish reversal could be a trading signal. Moreover, the ADX line has a downward slope towards the 20.00 line, which suggests a corrective downside pressure.
Based on this outlook, continued downside pressure with an H4 close below the 0.5400 level could lower the price before forming another bullish opportunity.
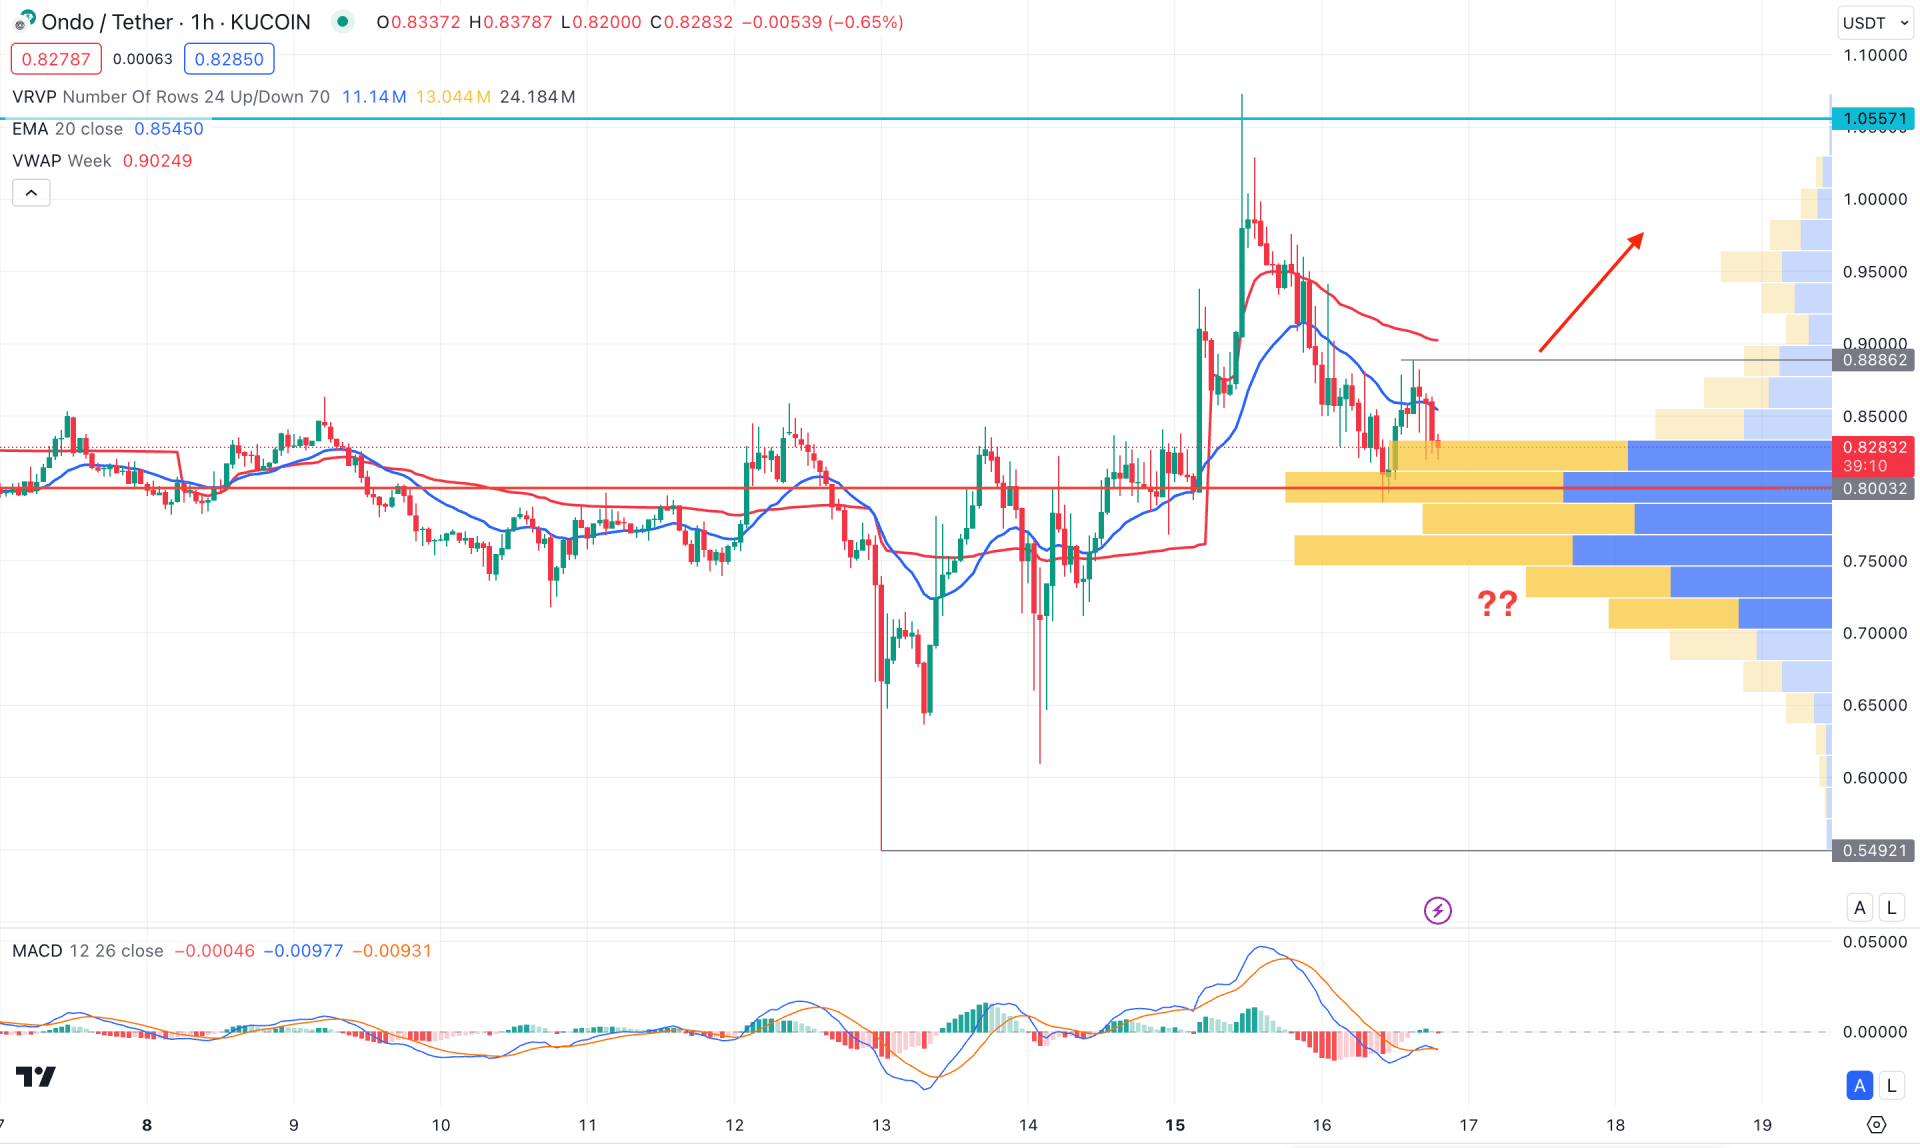
In the hourly timeframe, the current price hovers above the visible range high volume level, which suggests an ongoing bullish momentum. However, the dynamic 20 EMA and weekly VWAP suggest a downside pressure as the recent candlestick hovers below these lines.
The MACD Histogram hovers at the neutral line in the indicator window, while the signal line forms a bullish crossover at the bearish zone.
Based on this outlook, an immediate bullish pressure with an H1 candle above the 0.8886 level could be a bullish continuation signal, targeting the 1.0555 level.
On the other hand, the ongoing selling pressure is potent in the H1 chart, where an hourly candle below the 0.8000 high volume line could lower the price to the 0.6000 psychological level.
Based on the current market structure, ONDO/USDT is more likely to extend the minor downside correction before forming a bullish signal. Investors should closely monitor how the price reacts on the daily near-term swing low before forming a potential long opportunity.