
Published: April 10th, 2024
The recent buying pressure in Natural Gas (NG) was fueled by cooler weather forecasts throughout the United States. As heating demands increase in response to this change in weather patterns, natural gas demand is anticipated to rise. According to Maxar Technologies, predictions indicate lower temperatures in the western and central United States from April 12 to 19.
Prices dropped to a three-and-a-quarter-year low last Tuesday, and the natural gas market has been marked by considerable volatility this year. An exceptionally benign winter diminished the demand for natural gas for heating, resulting in an excess of inventories as of March 29. As a notable deviation from the seasonal average, inventories were 38.9% higher.
Furthermore, in March, extreme cold caused complications at the Freeport LNG natural gas export terminal in Texas, culminating in the cessation of operations at one of its production units. Although partially reopened, complete capacity will not be reinstated until May, which will affect natural gas exports from the United States and increase inventories.
Gas storage levels in Europe were comparatively high, exacerbating the supply surplus in the worldwide natural gas market. Baker Hughes reported on Friday that the quantity of operational natural gas drilling rigs in the United States fell to its lowest level in two years, at 110 rigs. This decline suggests that operators are adapting to the changing dynamics of the market.
Let's see the further aspect of this instrument from Natural Gas (NG) technical analysis:
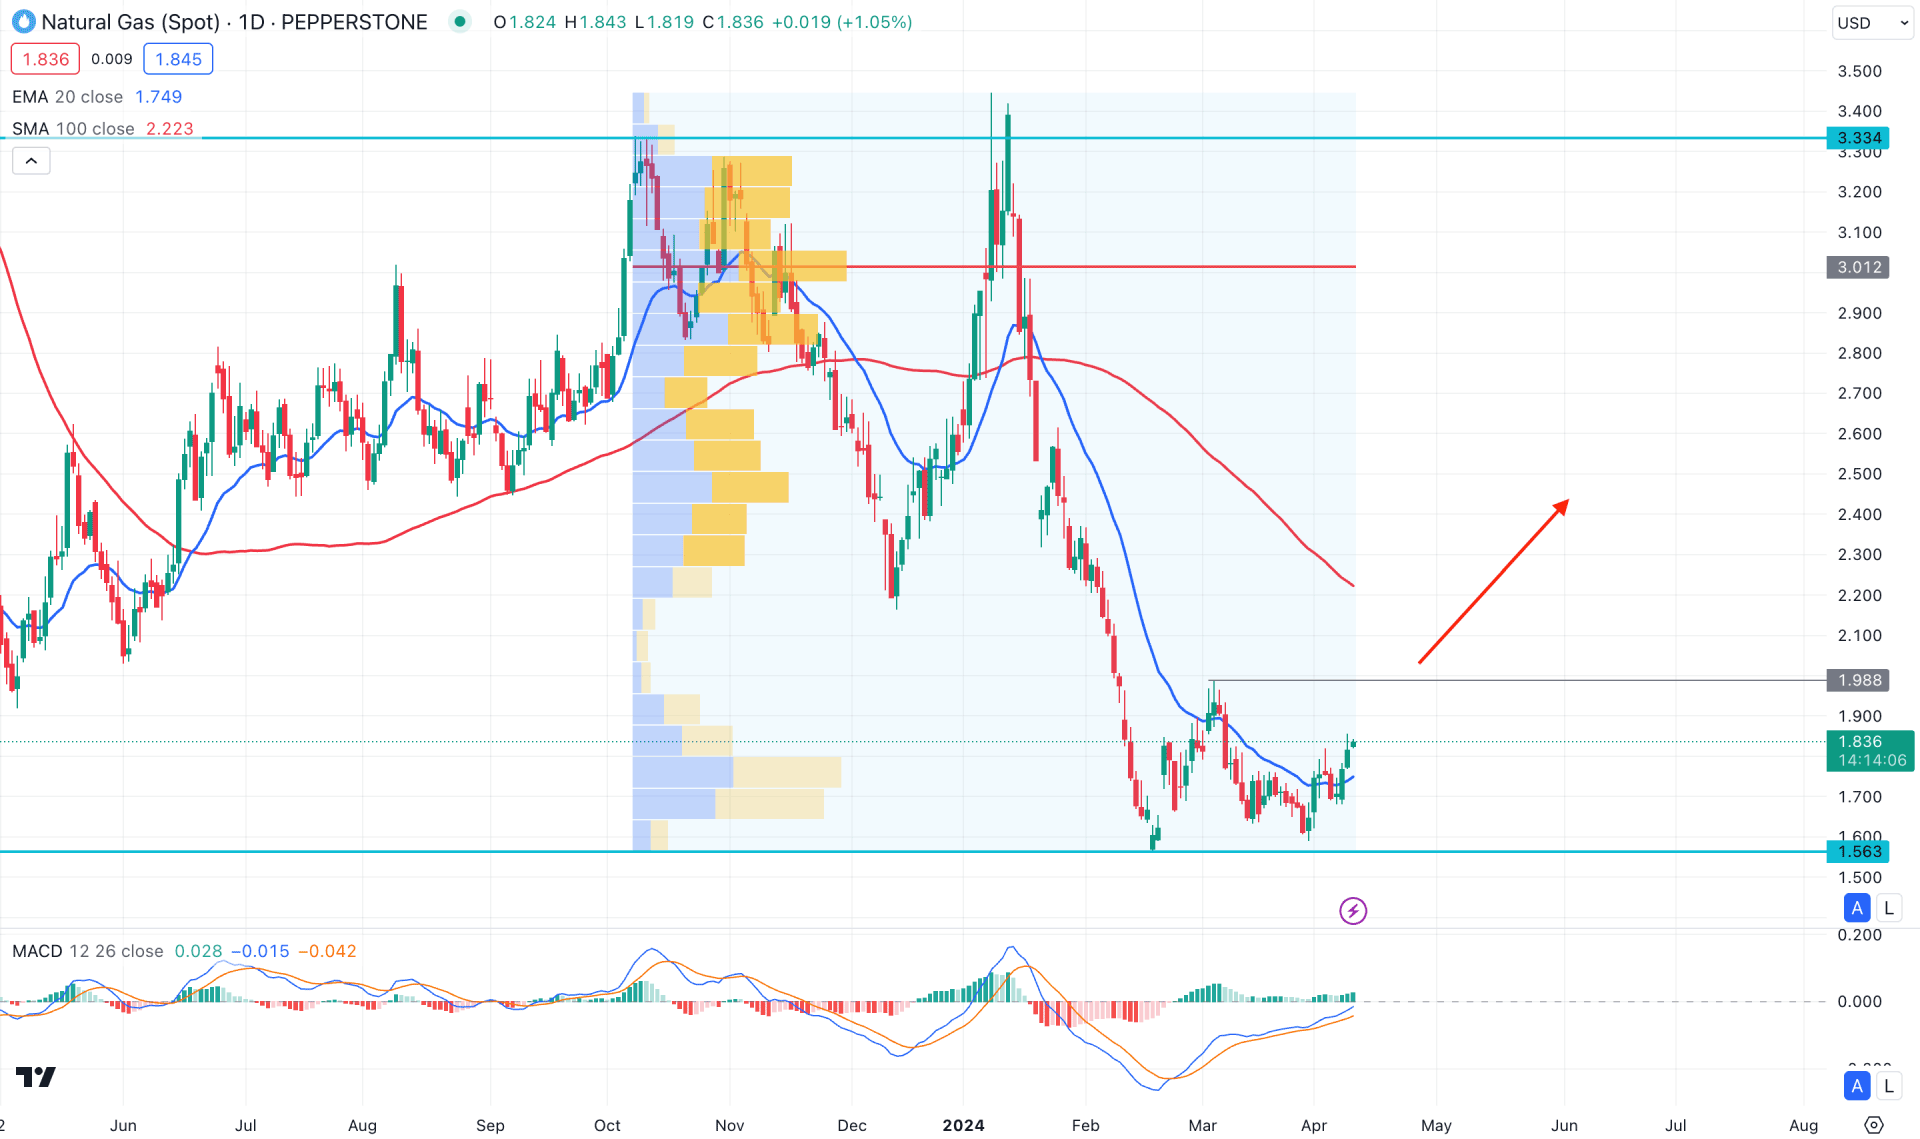
In the daily chart of NG, an impulsive bearish pressure is visible, coming with a buy-side liquidity sweep from the critical 3.334 swing level. However, the downside pressure weakened after reaching the 1.563 level, suggesting a possible upward pressure.
In the higher timeframe, no bullish candle is visible in the last six months, which suggests an ongoing selling pressure in the market. However, April came with bullish pressure, but it needs a solid close above the 1.826 level before validating a bullish reversal. However, an early bullish sign is visible, which needs a solid break above the 1.990 event level before validating the long signal.
In the volume structure, the most significant volume level since October 2023 is at the 3.012 level, which is way above the current price. As the recent selling pressure made a stronger gap, some minor upward pressure is potent as a mean reversion.
In the daily chart, an early bullish signal is visible as a valid daily close formed above the dynamic 20-day EMA level. However, the 100-day SMA is still above the current price, which is a crucial resistance.
Looking at the indicator window, the MACD Histogram is above the neutral line for more than 2 months, suggesting that bulls are in control. Moreover, the lagging Span showed a bullish reversal from the bottom and reached the neutral zone.
Based on the daily market outlook, a bullish continuation and a daily close above the 1.988 swing high could validate a bullish reversal in this instrument. A successful breakout with a consolidation could signal a potential long signal, aiming for the 3.000 psychological level in the coming days.
On the bearish side, a failure to hold the price above the dynamic 20-day EMA could signal a potential bearish continuation opportunity, targeting the 1.5000 level.
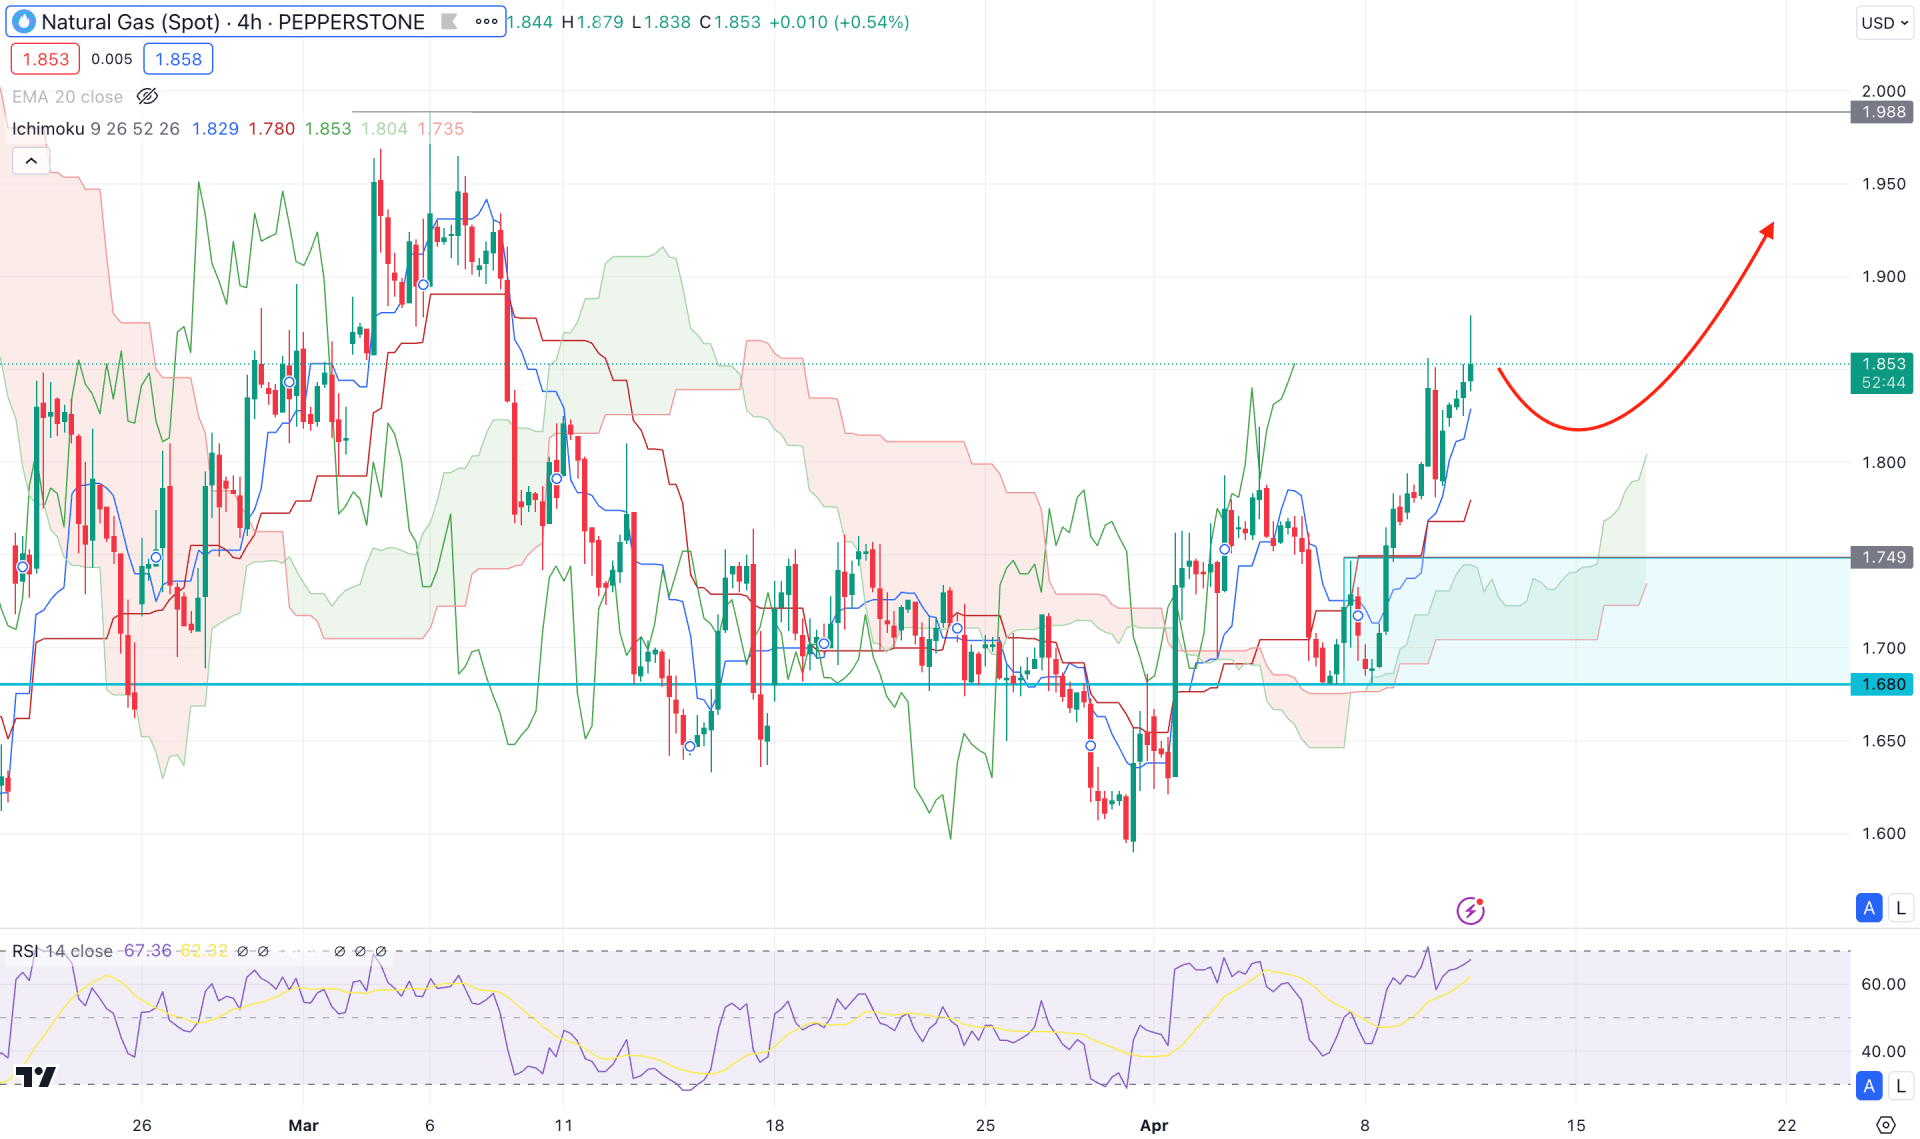
In the H4 timeframe, the overall market momentum is bullish as the recent price hovers above the dynamic Cloud area for a considerable time. Moreover, the future cloud is bullish as Senkou SPan A and Senkou Span B show bullish traction, while the dynamic Kijun Sen level is below the current price.
In the secondary window, the Relative Strength Index is bullish as it remains above the 50.00 line. However, the 70.00 level is still protected, which suggests that an overbought condition is not formed yet.
Based on the H4 structure, a downside correction is potent towards the dynamic Kijun Sen level before forming a bull run. In that case, any bullish reversal from the 1.7500 to 1.6800 area could be a potential long signal targeting the 2.000 level.
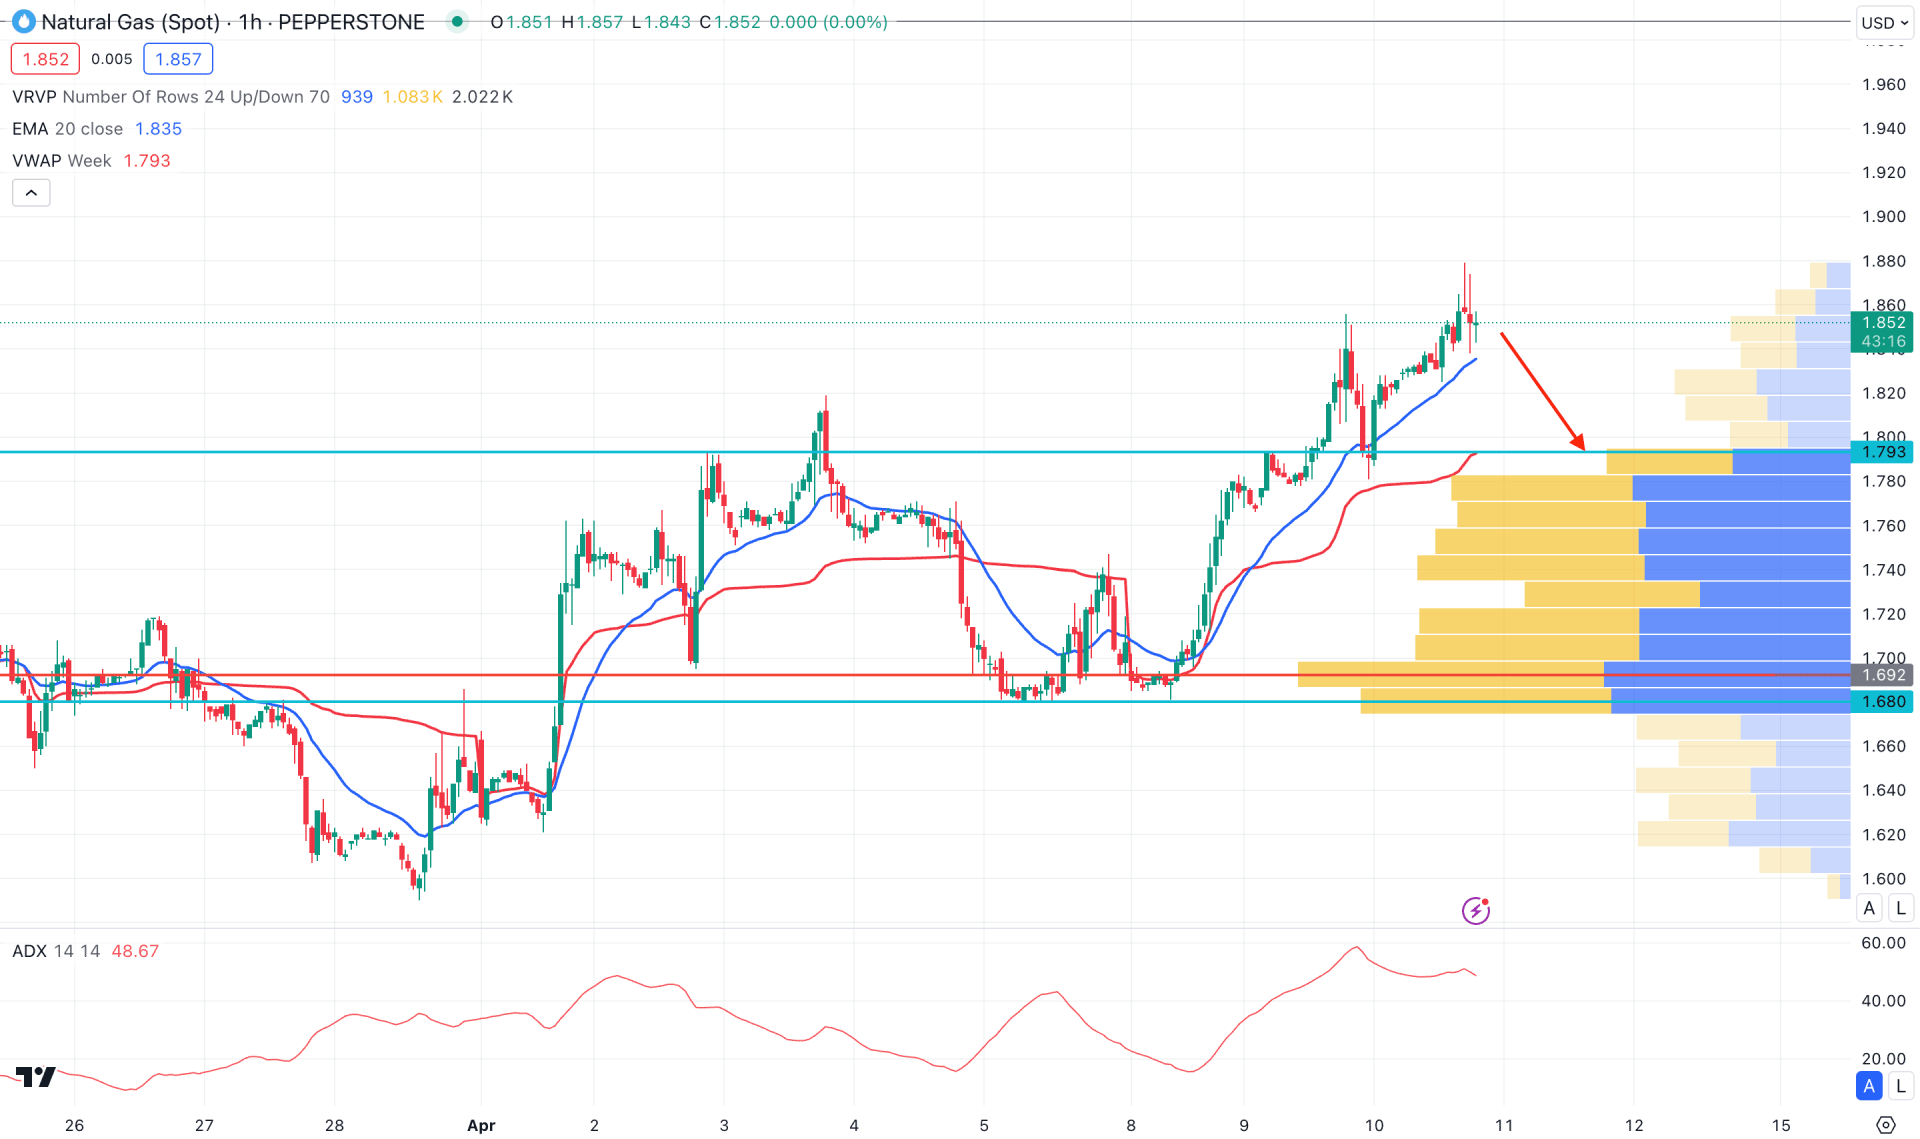
In the hourly time frame, the current price trades above the 1.793 static level, suggesting a bullish pressure in the market. Moreover, the visible range high volume level is at the 1.692 level, which is below the current price.
The dynamic weekly VWAP works as a crucial support at the 1.793 level, matching the crucial static line. The ADX should recover from the 80.00 level, with no sign of forming a significant downside momentum.
Based on this outlook, a buy-side liquidity sweep could validate a short opportunity after having a bearish H1 candle below the 1.790 level, which could lower the price toward the 1.720 level.
On the other hand, the long-term market momentum is optimistic for bulls, which might create a long signal by forming a bullish reversal from the 1.790 to 1.750 zone.
Based on the current multi-timeframe analysis, NG is more likely to move higher, where an early bullish signal is already provided in the lower timeframe. As the current price hovers at the all-time low area, the long-term bullish opportunity might come with a higher risk vs. reward ratio.