
Published: May 7th, 2024
The Jupiter token has declined significantly over the past month despite its remarkable development over the previous half-year. Amid the token's volatile value, investors exhibit a prudent sense of optimism, contemplating the potential for increased stability as it has been hovering near a recurring price threshold recently.
Jupiter (JUP) is a notable liquidity aggregator on the Solana blockchain. The company provides sophisticated trading solutions and actively engages its community via the Jupiter Work Groups initiative. The JUP token functions as a governance token, allowing community members to engage in decision-making procedures about authorization, punishment, and voting on many subjects on the Jupiter platform. The governance above framework facilitates collaborative development by encouraging community empowerment, transparency, and inclusiveness within the Jupiter ecosystem.
JUP's substantial market interest and accessibility are evidenced by its market capitalization, which measures its high liquidity. Elevated liquidity generally leads to more consistent price fluctuations and diminished volatility, rendering JUP an attractive option for investors in search of tradability and stability in the cryptocurrency sector.
With JUP currently trading above significant technical levels and exhibiting robust liquidity metrics, the token may continue to attract investment and interest.
Let's see the further aspect of this instrument from the JUP/USDT technical analysis:
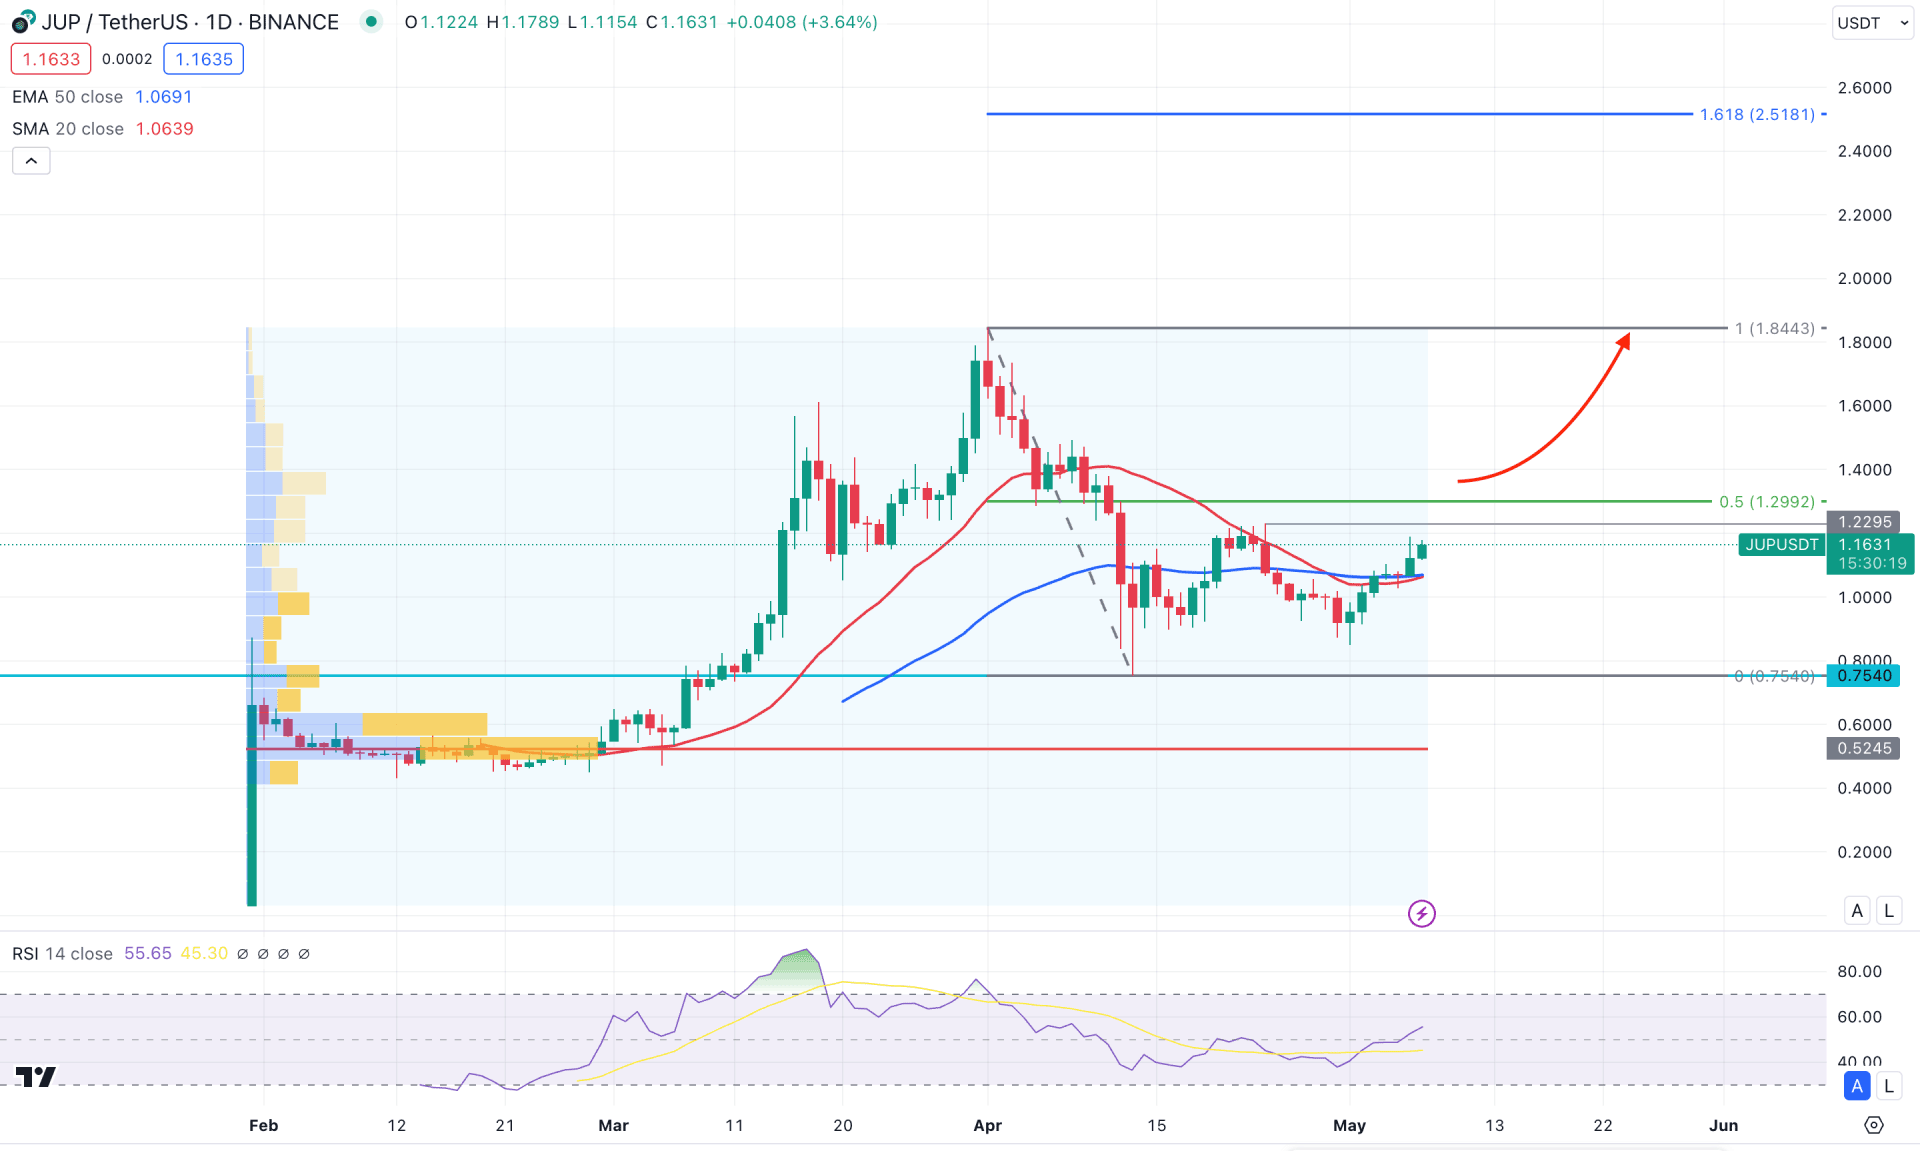
According to the daily chart of Jupiter (JUP), a significant price surge was seen after the Binance launch, making an all-time high at the 1.8443 level. Later on, the price went sideways and moved below the near-term swing low of 1.0519 level. In this context, a new bull run might come after validating the bottom below the dynamic 50-day EMA level.
Looking at the volume structure- the most significant level is marked at the 0.5245 level, which is way below the current price. Since March 2024, the price has maintained a stable momentum above the high volume line, suggesting an ongoing buyers interest. Based on this, we may expect bulls to regain the momentum at any time, depending on the price action.
In the higher timeframe, April 2024 closed bearish but failed to breach the March low. The inside bar formation in the monthly chart indicates a bearish correction, from which a bullish impulse could appear. The bullish possibility is supported by the weekly price action, as the last few candles remained sideways, with a sell-side liquidity sweep. However, a clearer picture regarding the bottom formation might come from the daily price.
After forming a swing low at the 0.7540 level, the price went sideways with no sign of a bullish recovery. Moreover, the 20 day SMA line came below the 50 day EMA line but went sideways. It is a sign of an indecision, where a clear picture needs a valid breakout.
As the 14-day Relative Strength Index (RSI) rebounded above the 50.00 neutral level after a month, which could work as an additional bullish signal.
Based on the daily price outlook of JUP/USDT, a valid bullish daily close above the 1.3000 psychological level could validate the 0.7540 bottom, creating a potential long opportunity. In that case, the upward pressure might extend and the price could reach the 2.5000 psychological level soon.
The alternative trading approach is to monitor how the price reacts at the 50 day EMA line. A failure to hold the momentum above it with an immediate bearish daily close below the 1.0000 level could lower the price below the 0.7500 level.
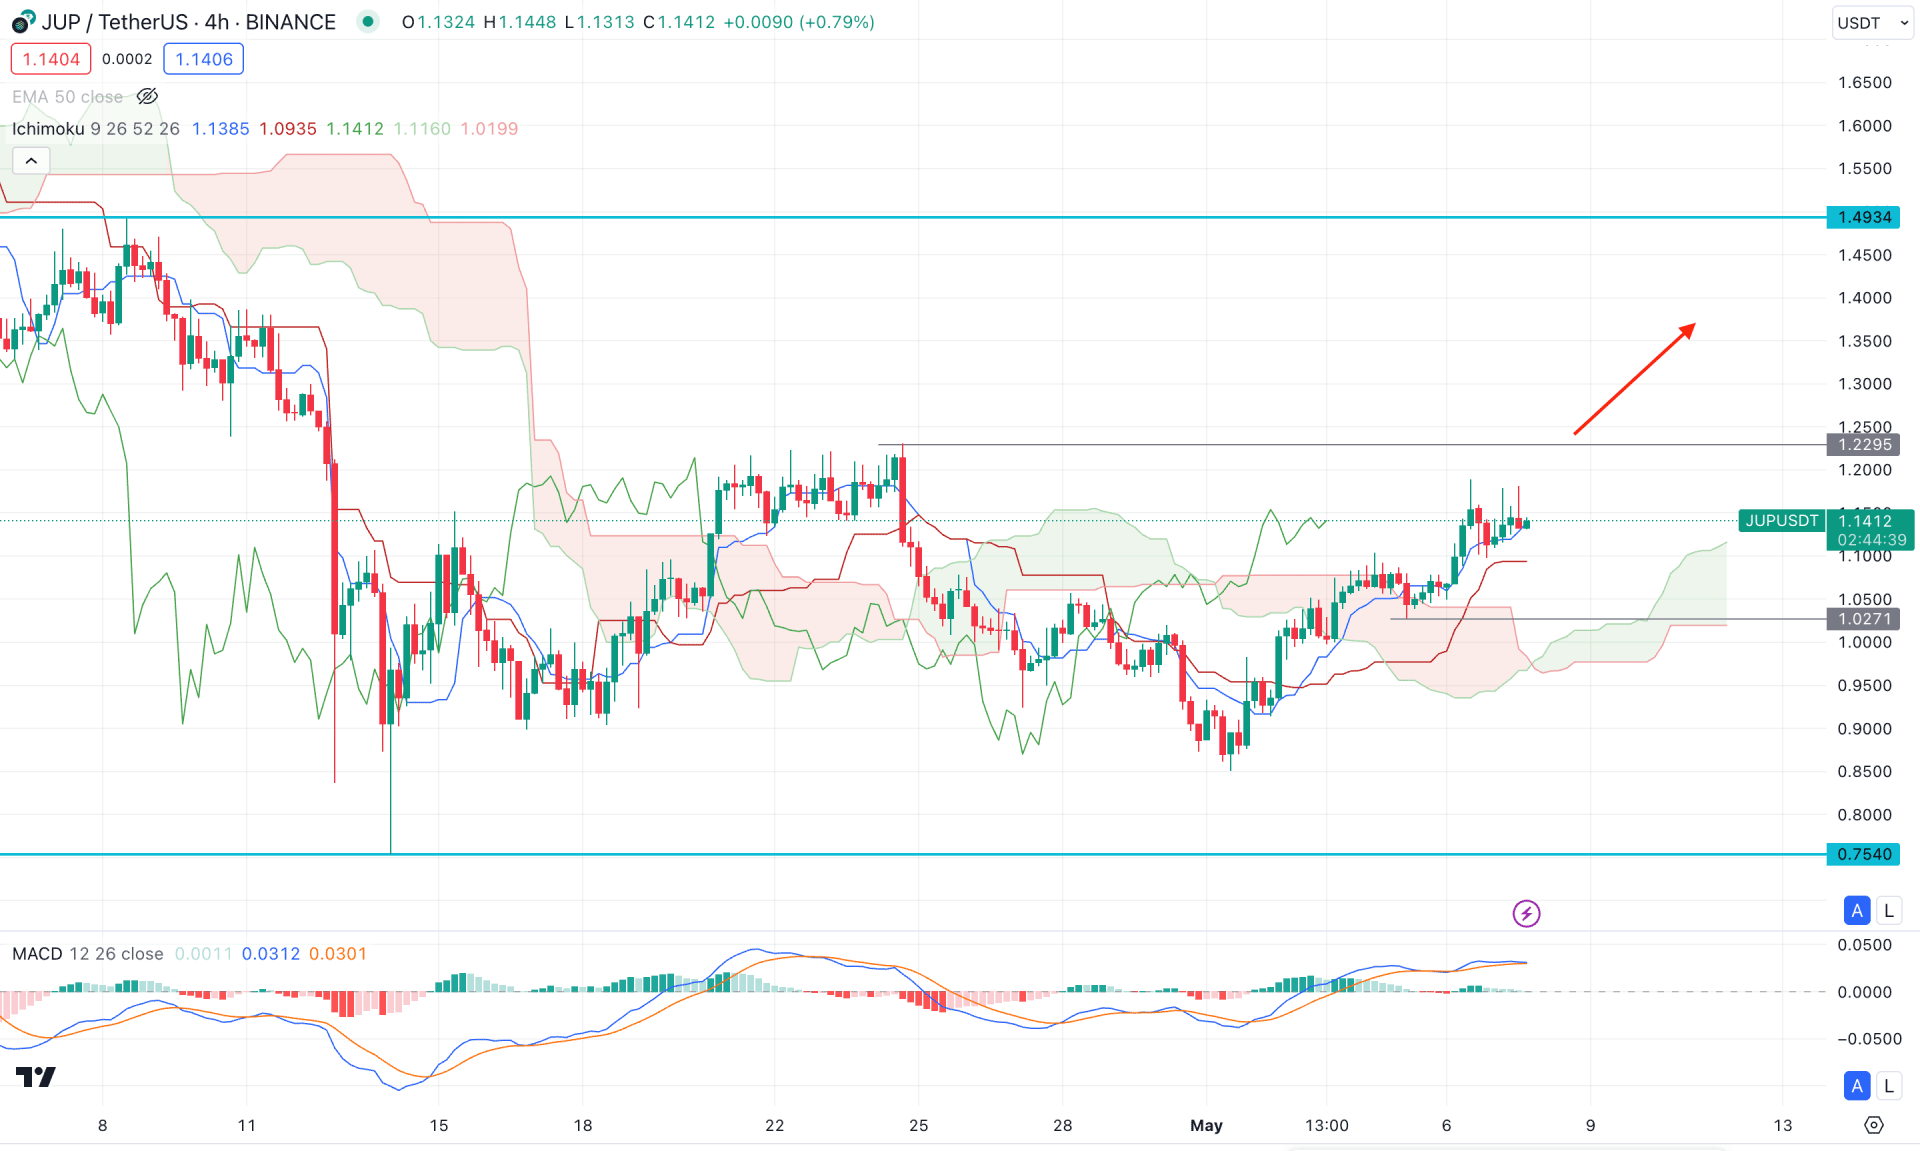
In the H4 timeframe, the JUP/USDT price shows a bullish continuation as the recent price hovers above the dynamic Cloud zone. Moreover, the Kijun Sen is below the current price, while the future cloud looks solid for bulls.
In the indicator window, a sideways momentum is visible at the MACD Signal line as it reaches the peak, while the Histogram is at the neutral point.
Based on the H4 structure, a downside correction and a bullish reversal from the 1.0271 to 0.9500 zone could be a valid long opportunity, targeting the 1.5000 level.
On the other hand, an immediate downside pressure with a valid bearish H4 candle below the 0.9000 level might alter the current market outlook and lower the price in the coming hours.
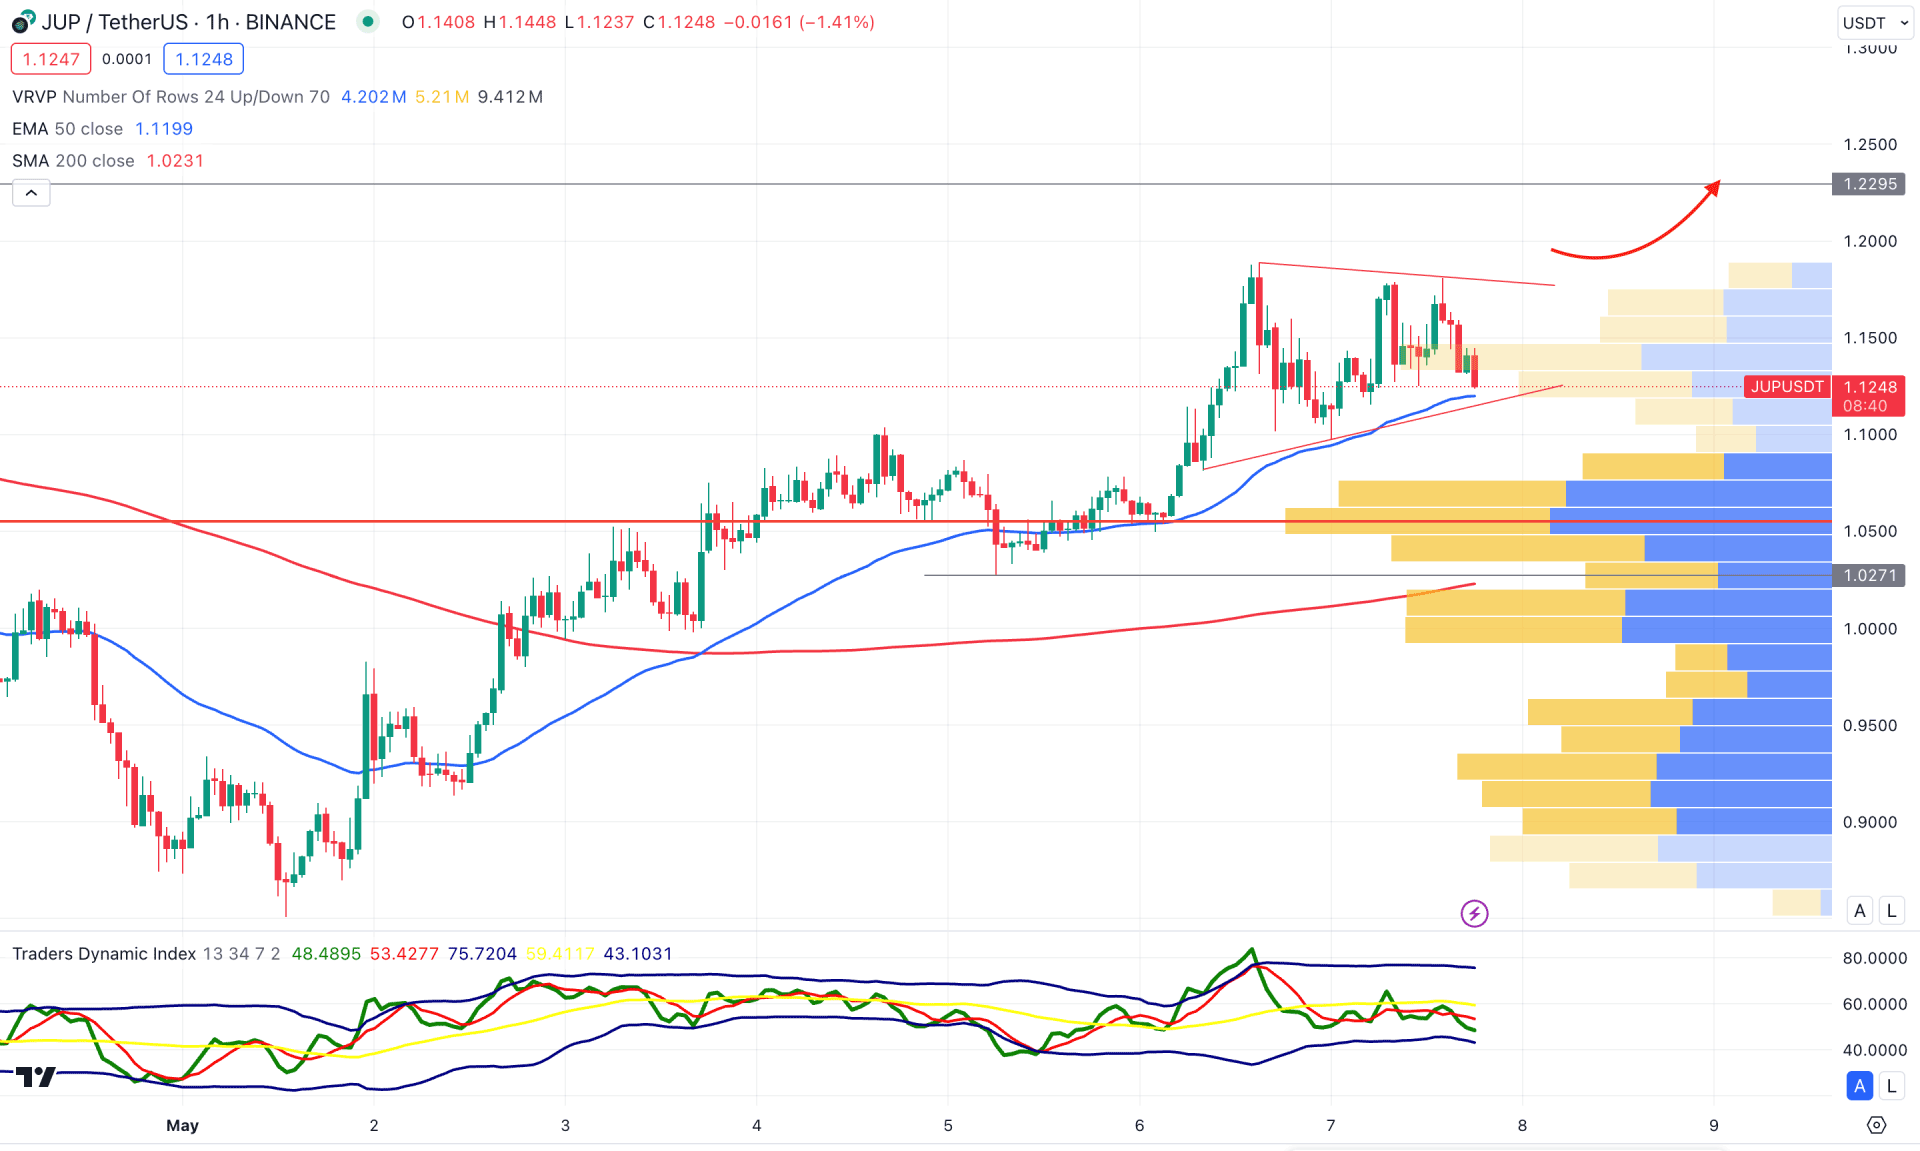
In the h1 chart, the 200 Simple Moving Average is the major support as the current price hovers above this line after a valid Golden Cross formation. The visible range high volume level is another crucial indicator for this instrument, which is also below the current price.
In the secondary window, the Traders Dynamic Index (TDI) line moved below the 50.00 level, suggesting an ongoing bearish correction. However, the TDI line failed to reach the bottom as the lower band is still untouched.
Based on this outlook, we may expect the buying pressure to extend in the coming hours. The ideal trading approach is to look for an hourly candle above the 1.1820 level before anticipating a bull run, targeting the 1.5000 level.
Based on the ongoing price action, JUP/USDT has a higher possibility of extending the buying pressure in the coming days. The ideal trading approach for this instrument is to look for a valid long opportunity after forming a bullish breakout above the 1.300 psychological line.