Published: April 17th, 2024
Ares, a diversified alternative asset manager founded in 1997 by Tony Ressler, co-founder of Apollo Global Management, engages in direct lending, private equity, infrastructure, and real estate investments. The firm witnessed a substantial increase in earnings per class-A share (EPS) by 39% to 86 cents, in conjunction with assets under management that amounted to $418.8 billion in the fourth quarter, representing a 19% boom.
Despite fundraising challenges that afflicted the entire industry, Ares attained its second-highest fundraising year, amassing a considerable dry powder of more than $110 billion that is now prepared for strategic investments in intriguing opportunities. During the Q4 earnings call, CEO Michael Arougheti underscored the company's favorable position, emphasizing the substantial earnings growth that could occur in future years.
Ares's real estate portfolio comprises a negligible 4% of office buildings. However, a recent joint venture aims to exploit troubled office properties in New York by capitalizing on favorable market conditions in the face of limited capital availability.
Recent reports indicate that Rosenthal, co-founder and chairman of Ares Management, sold a substantial portion of his company holdings. Despite this noteworthy transaction, which surpassed $6.4 million, Rosenthal's direct holdings have been diminished to zero. However, he retains an indirect investment in Ares Management Corp. through BAR Holdings, LLC, an entity under his control.
Insider transactions, including Rosenthal's sales, frequently indicate management's assessment of the company's valuation and future prospects. Although the volume of Rosenthal's sales attracts attention, their premeditated nature mitigates concerns regarding the timing of the company's performance.
Let's see the future price direction of this stock from the ARES technical analysis:
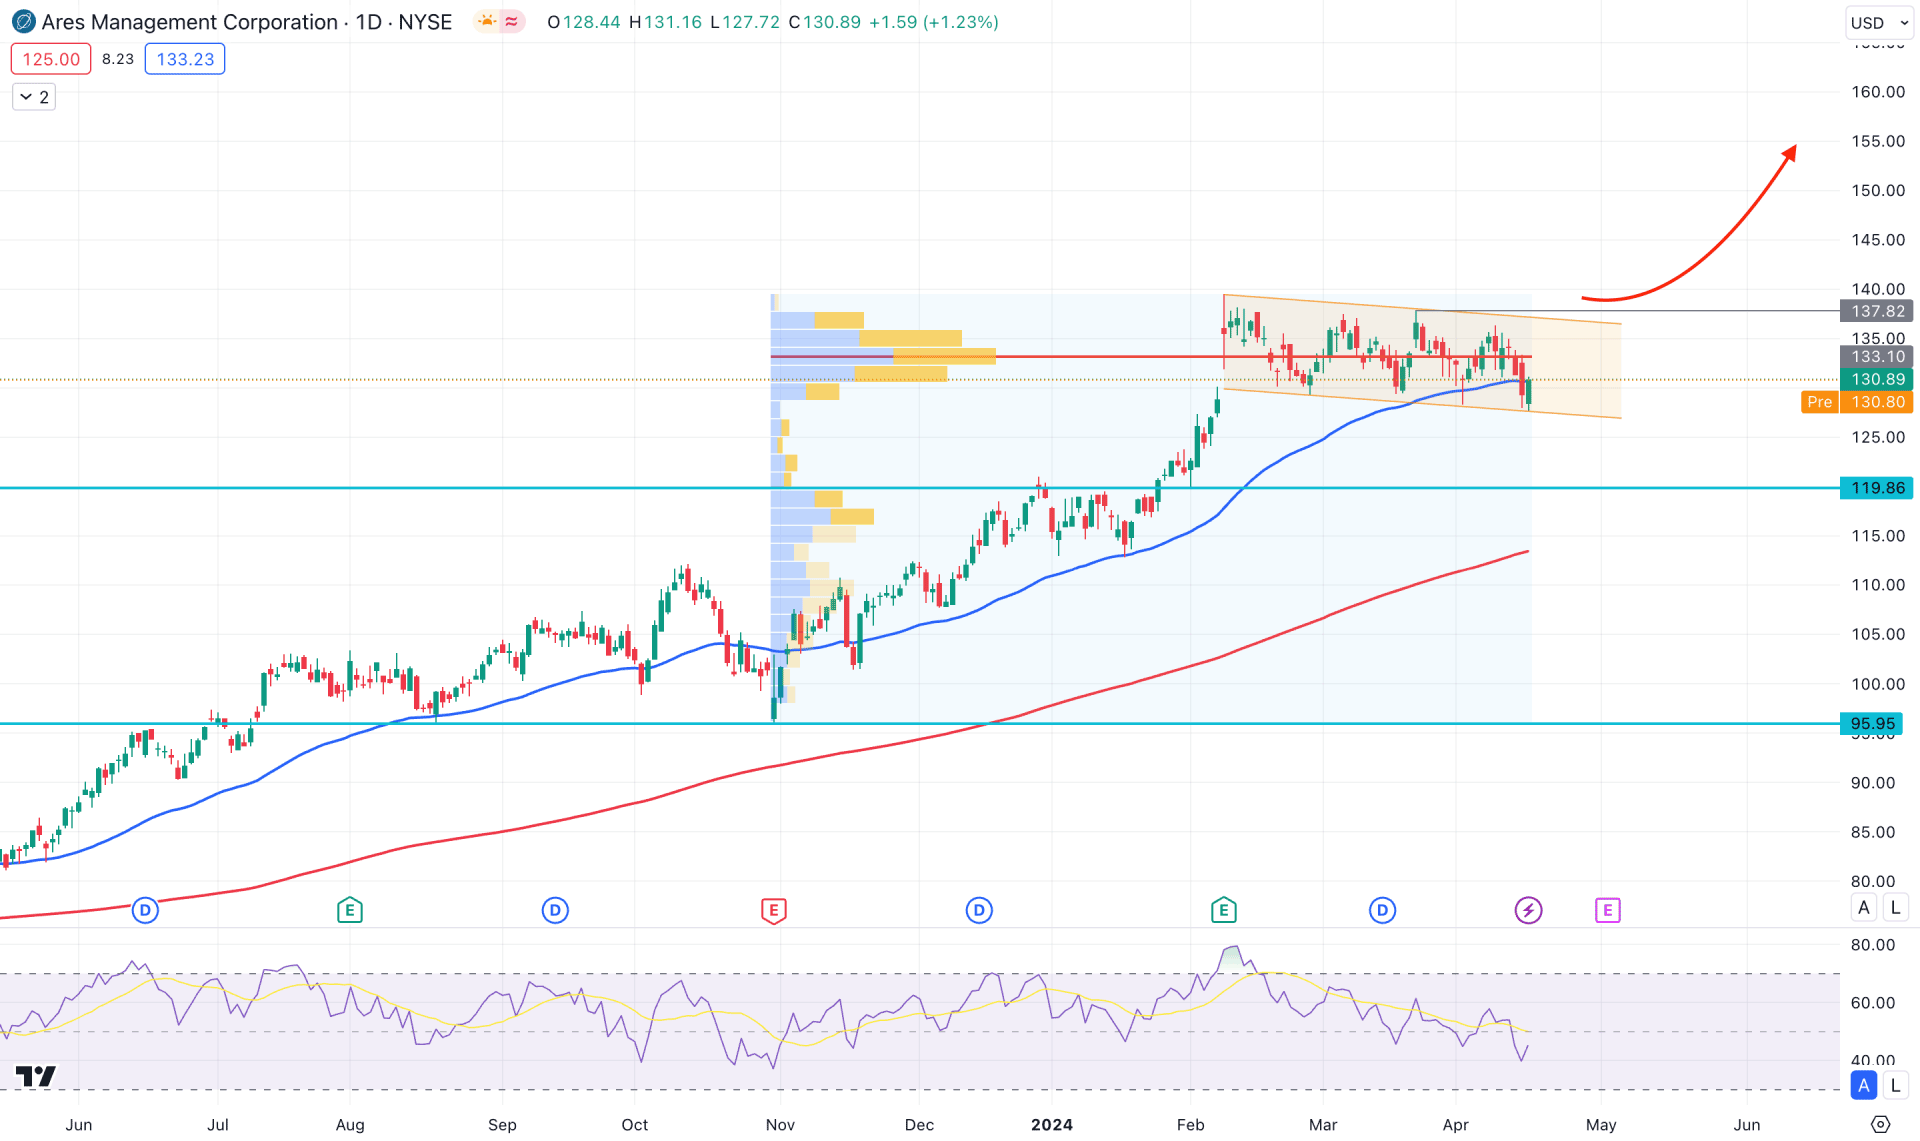
In the daily chart of ARES, the ongoing buying pressure is potent, as the price has maintained growth since the beginning of 2024. However, the price became sideways after forming a top at the 139.91 level. In that case, investors should monitor how the price trades in this area, from which a potential bullish reversal is possible.
In the higher timeframe, the weekly price suggests an extreme corrective pressure as multiple indecision candlesticks are visible within a descending channel. Based on this, a bullish trend continuation has high potential, whereas a trend continuation signal needs a valid rejection in the weekly candle.
In the volume structure, the highest trading volume level since November 2023 is at 133.10 level, which is above the current price. Therefore, a trend-following method needs a stable price above this line along with a valid price action before anticipating a long signal.
The 50-day Exponential Moving Average in the daily structure is closer to the current price, working as a support. Moreover, the 200-day SMA line is below the 119.86 static support level and is working as a major support.
In the indicator window, the 14-day Relative Strength Index (RSI) hovers below the 50.00 line, suggesting a bearish signal. As the RSI is yet to reach the 30.00 oversold zone, we may expect the downside correction to extend before forming a long signal.
Based on the daily market outlook of ARS, the first long signal might come with an immediate channel breakout with a daily close above the 137.82 line. However, a channel extension is possible, which might create another long opportunity after reaching the 125.00 to 120.00 area with a bullish reversal candlestick.
On the other hand, an immediate downside pressure with a daily candle below the 120.00 line would extend the downside pressure in this stock, targeting the 200-day Simple Moving Average line.
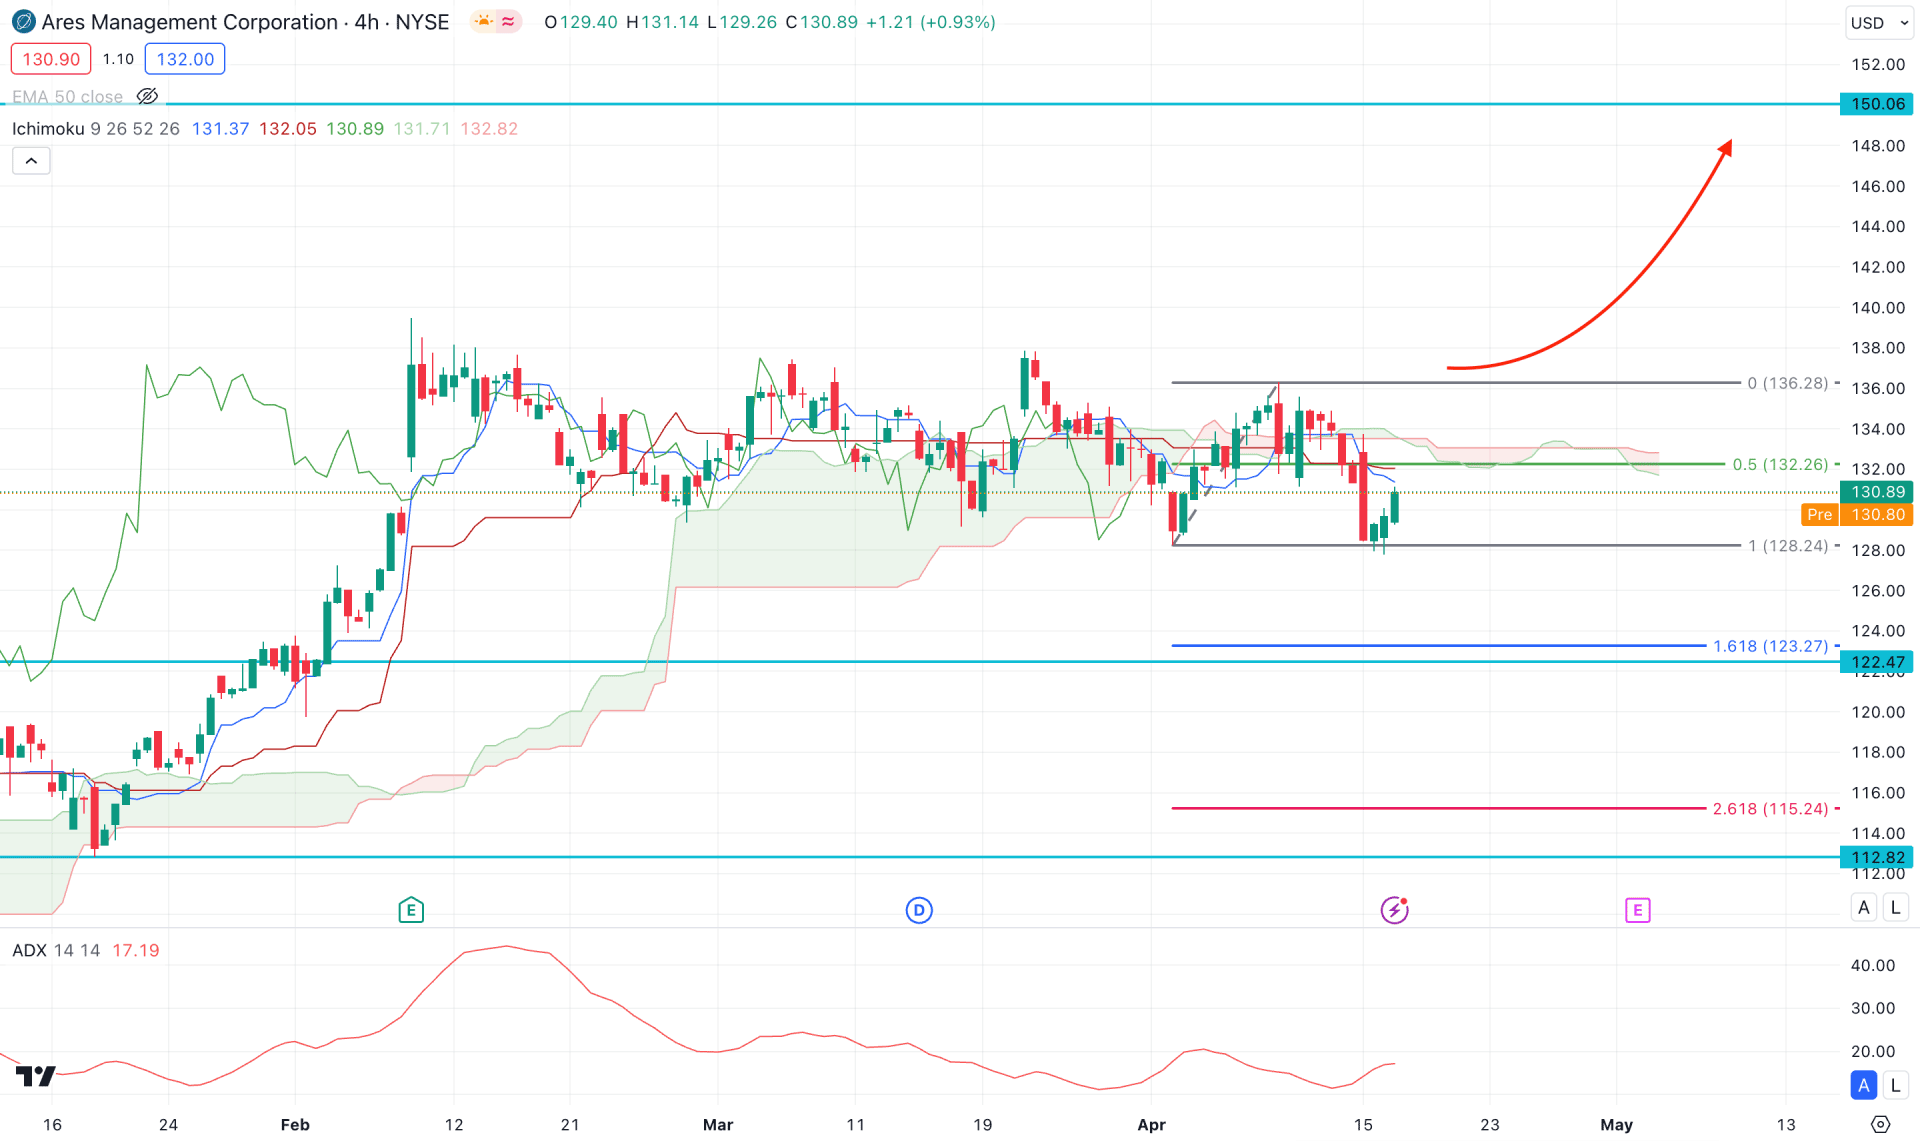
In the H4 timeframe, the recent price trades sideways, with several violations from the dynamic Ichimoku Cloud area. However, the ongoing consolidation is backed by a bullish, impulsive wave. Therefore, a re-accumulation phase has a higher possibility of taking the price even higher after forming a valid manipulation.
As per the current outlook, the current price hovers below the dynamic Ichimoku cloud zone with no significant low violations. In that case, the price is more likely to extend the downside pressure, as shown in the ADX line.
In the bullish outlook, a potential bullish reversal with a valid H4 candle from the 124.00 to 120.00 area could take the price higher at the 150.00 psychological line.
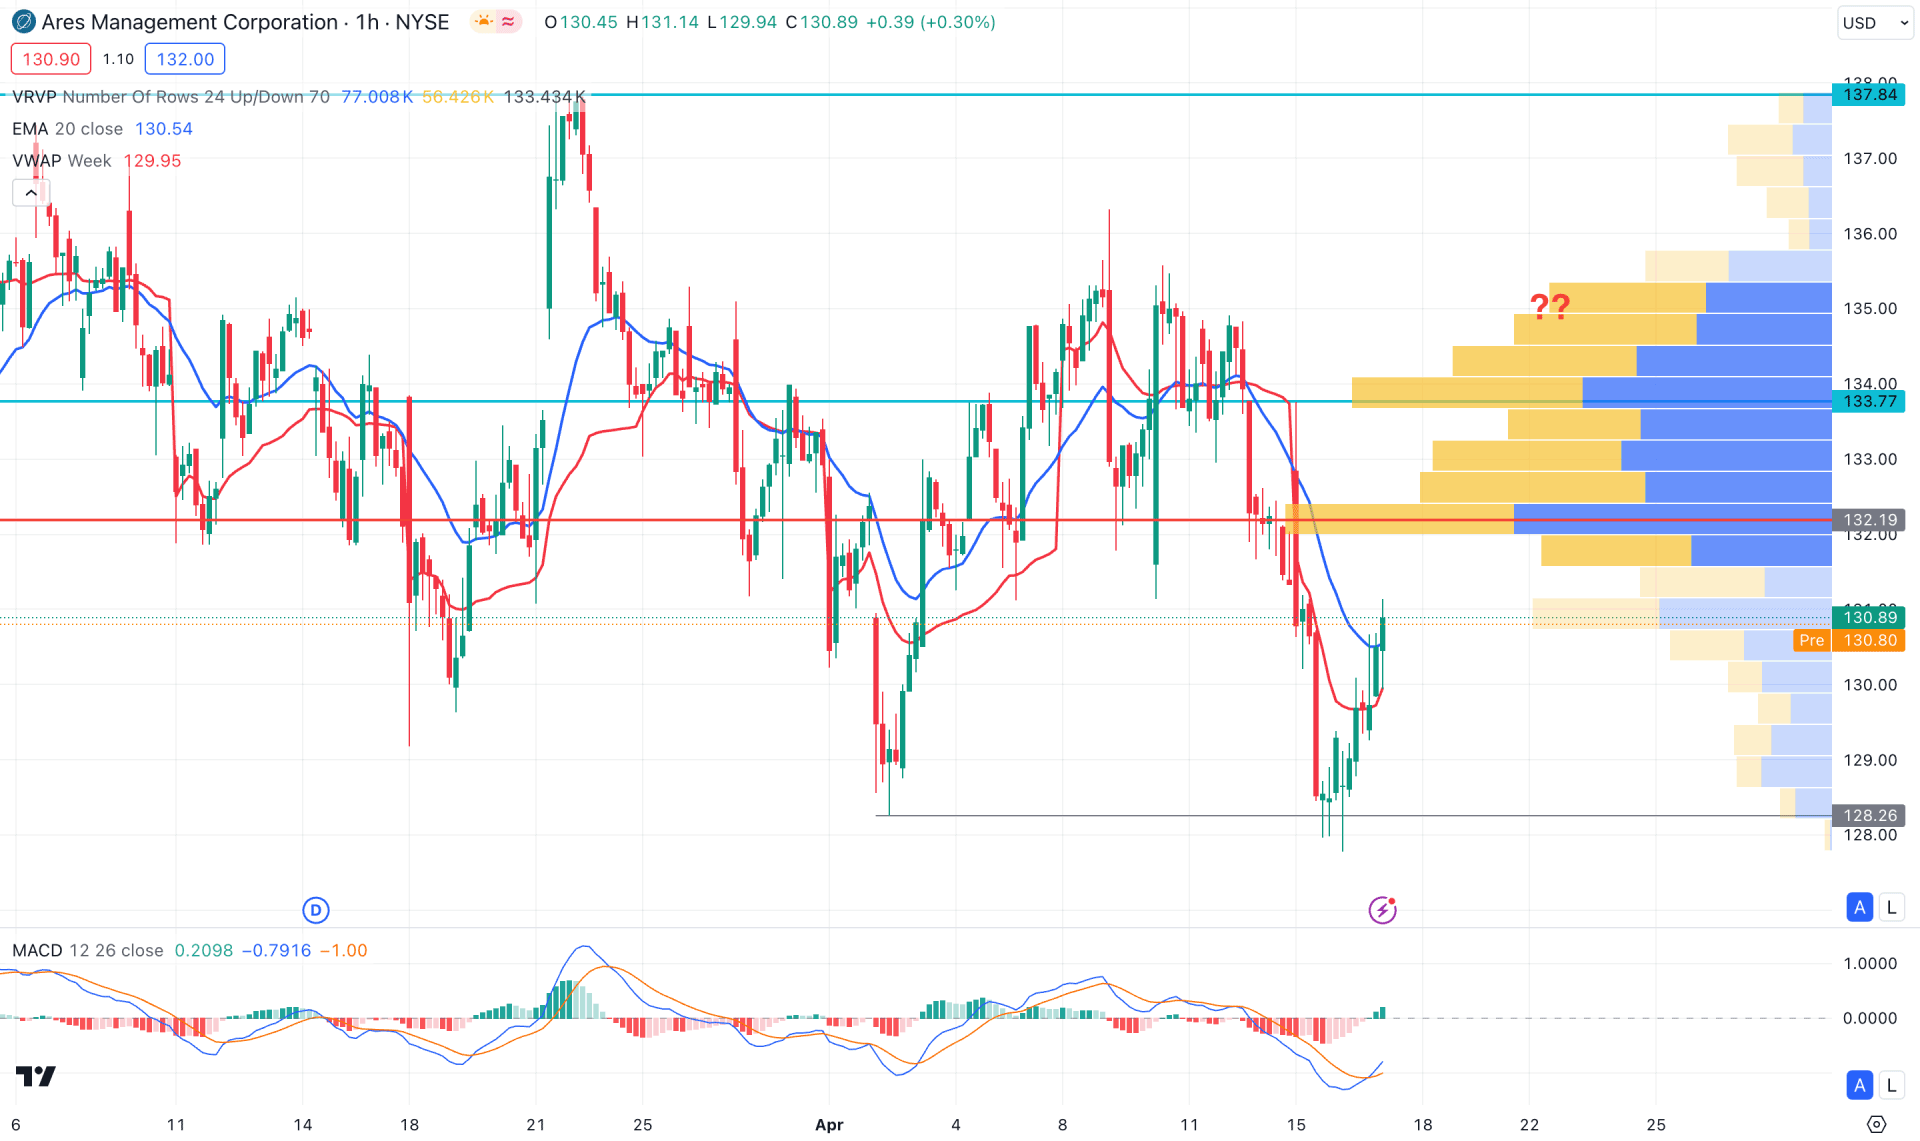
In the H1 timeframe, the recent price trades are below the visible range of a high volume level, which suggests a minor downside pressure. However, a sell-side liquidity sweep from the 128.26 low came with a valid H1 close above the dynamic 20 EMA line.
Moreover, the MACD Histogram shifted its direction and formed multiple lines above the neutral zone, while the Histogram shows a potentially bullish signal with a crossover at the oversold zone.
Based on this structure, a bullish continuation with an H1 candle above the 133.77 resistance level could be a potential long signal, targeting the 150.00 level.
On the other hand, an immediate bearish reversal from the dynamic weekly VWAP line might lower the price and create a new low below the 128.00 area.
Based on the current market structure, ARES bulls remain active and can initiate a new impulsive wave once the re-accumulation phase is over. Investors should closely monitor the intraday price to join the rally as early as possible.