Published: May 1st, 2024
The first-quarter 2024 financial results of 3M Company, commonly known as MMM, surpassed the revenues and earnings forecast set by Zacks Consensus (CSV). When rectified, both the top and bottom lines increased compared to the preceding year.
Organic sales increased by 2.6% year-over-year in the Asia Pacific region, whereas in the Americas, they declined by 0.9%. Organic sales in Europe, the Middle East, and Africa increased by 3.3%.
In April 2024, 3M successfully finalized the spin-off of its Healthcare division as an independent public entity. Notably, the unit's performance is reflected in the first-quarter results.
At 1.7% less than last year, Safety and Industrial generated $2.73 billion in revenue, predominantly attributable to a 1.4% decline in organic revenues and a slight adverse effect from foreign currency translation.
The 6.9% year-over-year increase in Transportation & Electronics revenues to $1.82 billion was primarily attributable to a 6.7% rise in organic sales. Acquisitions contributed a positive 1.7%, whereas foreign currency translation had a negligible adverse effect.
At the end of the quarter, cash and cash equivalents totaled $10.9 billion, whereas long-term debt stood at $20.6 billion.
Net cash generated from operating activities declined 39.8% annually, accompanied by a 21.1% reduction in capital expenditures.
With a conversion rate of 63%, adjusted free cash flow decreased by 11.9% year-over-year to $833 million.
For the first quarter, the total quantity of dividends paid to shareholders was $835 million. It is anticipated that adjusted earnings per share will range between $6.80 and $7.30, while adjusted total sales will either increase or decrease by 1.75 percent, representing a growth rate of 0 to 2 percent for adjusted organic sales. The dividend payout ratio is expected to be approximately 40% of the adjusted free cash flow.
Let’s see the further aspect of this stock from the CVS technical analysis:
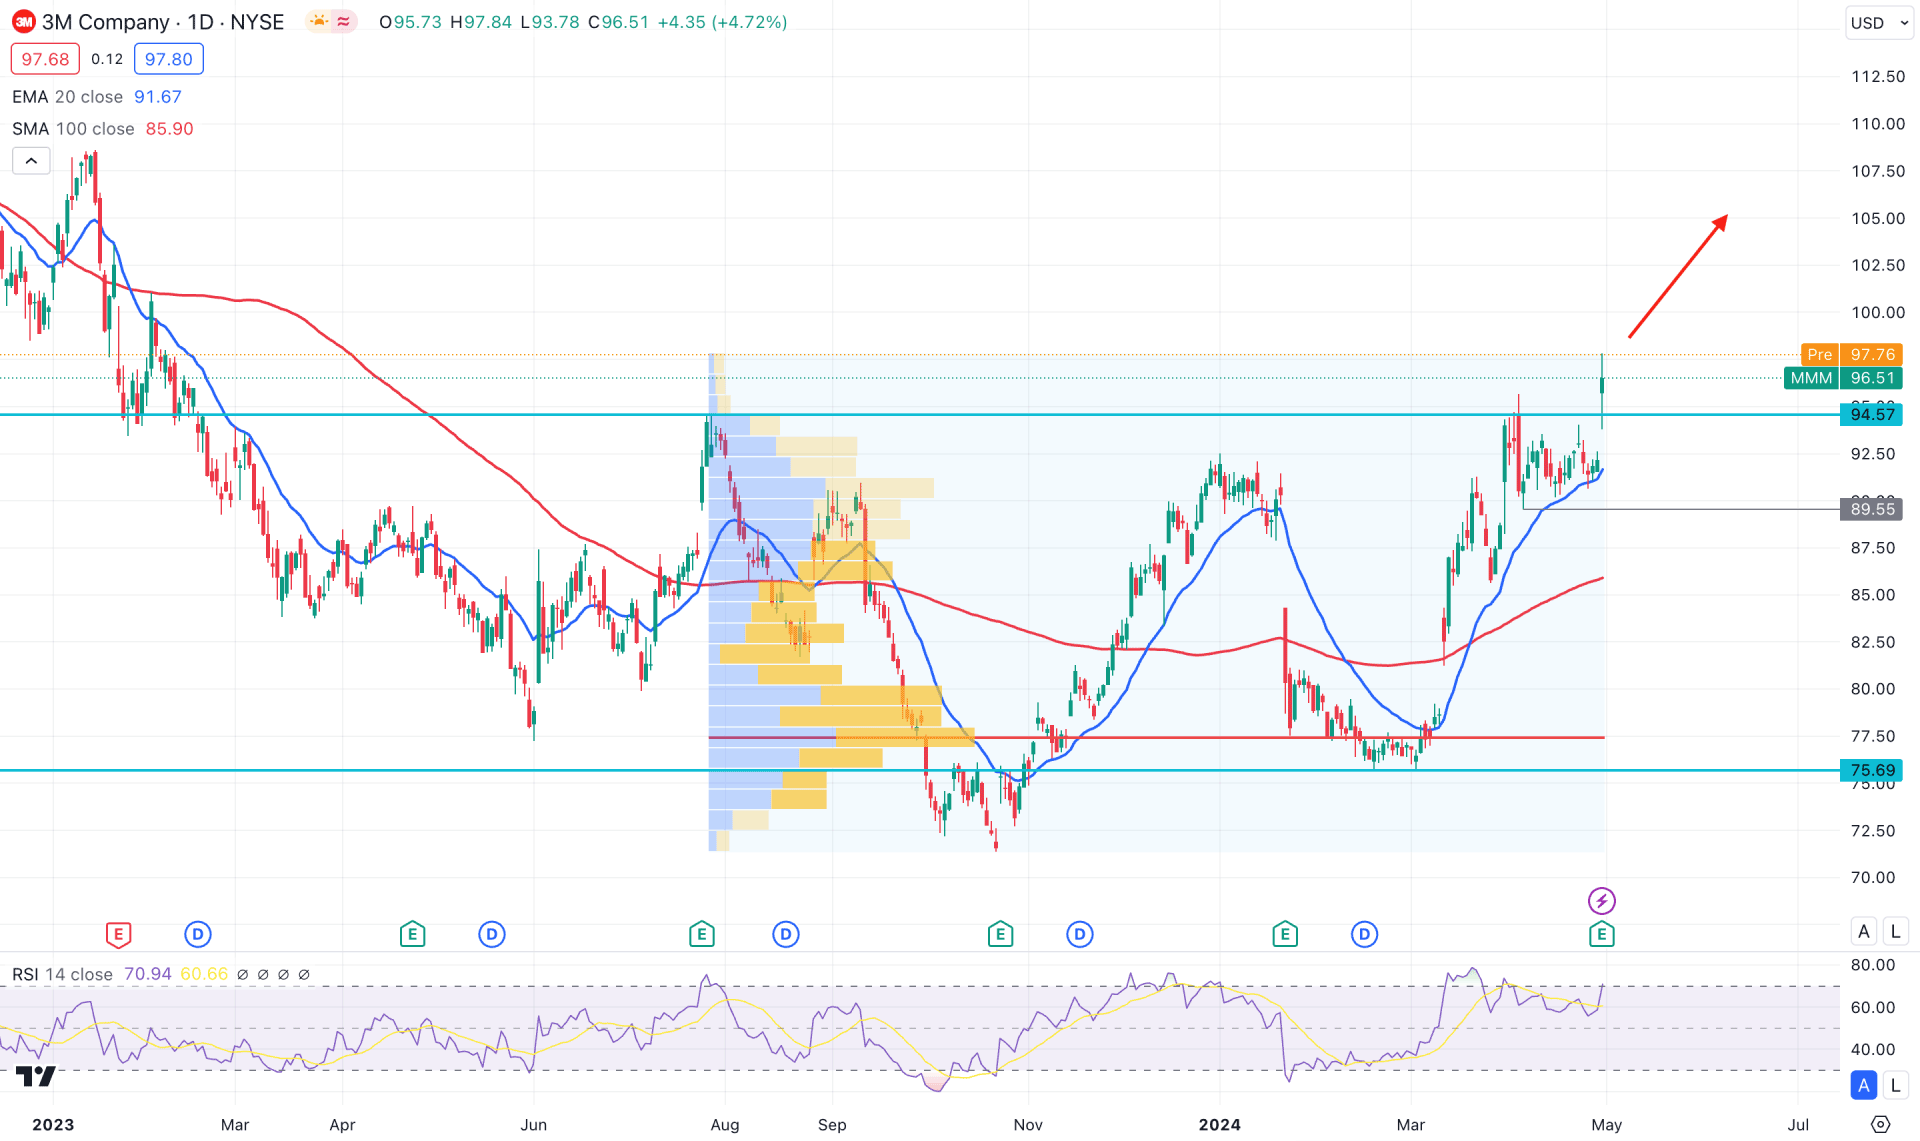
In the daily chart of MMM, the broader context is corrective as the price remained range bound since August 2023. However, a downside continuation came in Q4 of 2023, creating a sell-side liquidity sweep. As the current price hovers at the rectangle resistance, we may expect buying pressure after having a solid breakout supported by a larger volume.
In the volume indicator, the highest activity level since August 2023 is at 77.40, which is below the current price. This is a sign that sufficient bullish orders are present, which, depending on the price action, might increase the possibility of continuing the bullish trend.
The monthly candlestick pattern suggests a potential bullish breakout in the higher timeframe as the running candle hovers above the 20-month Simple Moving Average line. However, the proper validation of the breakout might come after having a solid bullish weekly candle above the 100.00 psychological line.
In the daily price action, the 20-day exponential moving average carries the ongoing buying pressure, while the 100-day SMA is a major support. As both lines have a bullish slope, we may consider the current trend bullish. Moreover, another confluence bullish signal is present from the RSI indicator, where the current RSI line is at the 70.00 overbought level.
Based on the daily market outlook of MMM, the early sign of a bullish breakout is present from the technical breakout with a solid fundamental background. In that case, a bullish daily candle above the 100.00 psychological line could be a conservative long approach, targeting the 115.00 psychological level.
The alternative trading approach is to wait for the downside correction to extend, where a daily candle below the 89.50 level could be a bearish signal, targeting the 75.69 support level.
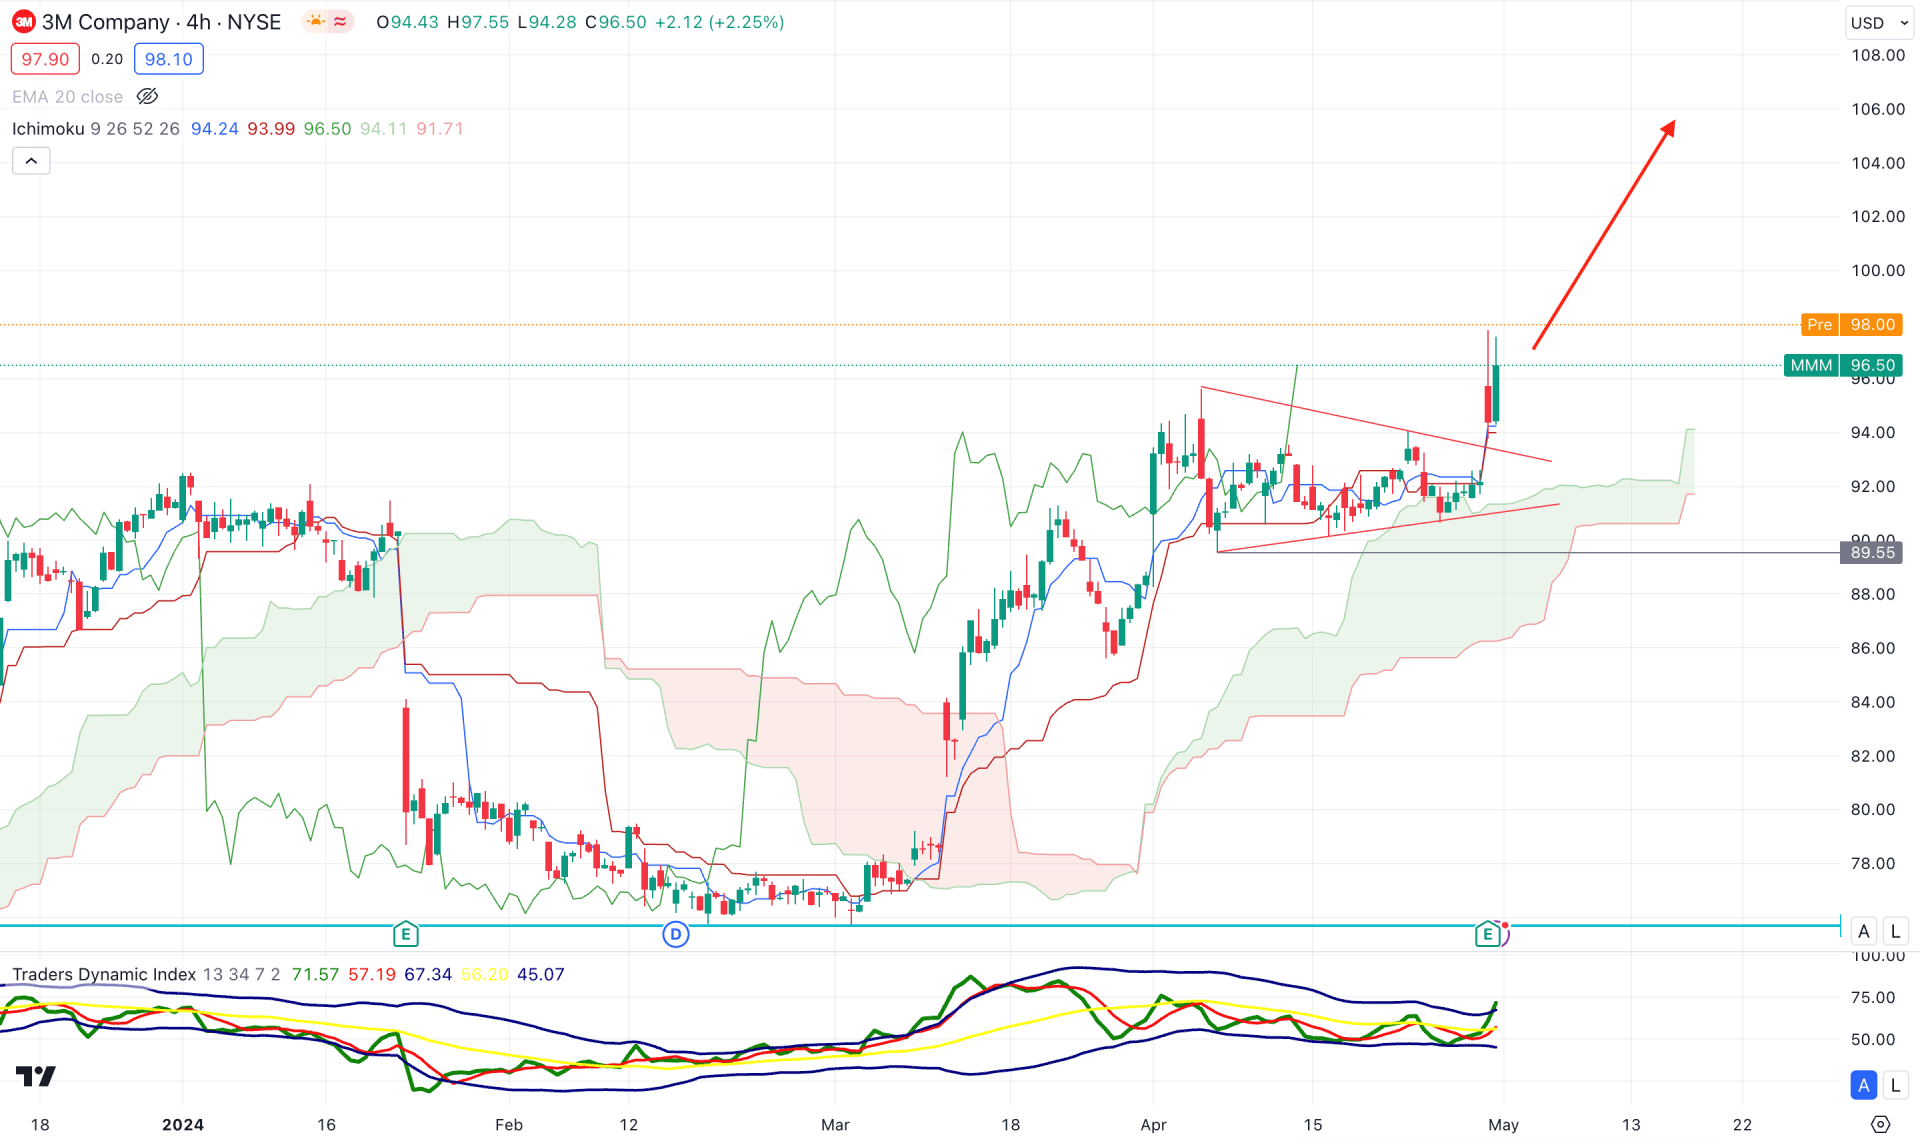
In the H4 timeframe, the MMM price trades higher, supported by the bullish pennant breakout. Moreover, the ongoing buying pressure is potent as the recent bullish recovery found a bottom from the dynamic Ichimoku Cloud support. The future cloud is also supportive as the current Senkou Span A is above the Senkou Span B with a bullish slope.
In the Traders Dynamic Indicator, the current line showed an upward recovery and moved beyond the 50.00 neutral line.
Based on this structure, an immediate buying pressure is potent, which can extend the price above the 115.00 psychological line. Another long approach might come from the 95.35 to 92.00 zone with a solid bullish reversal.
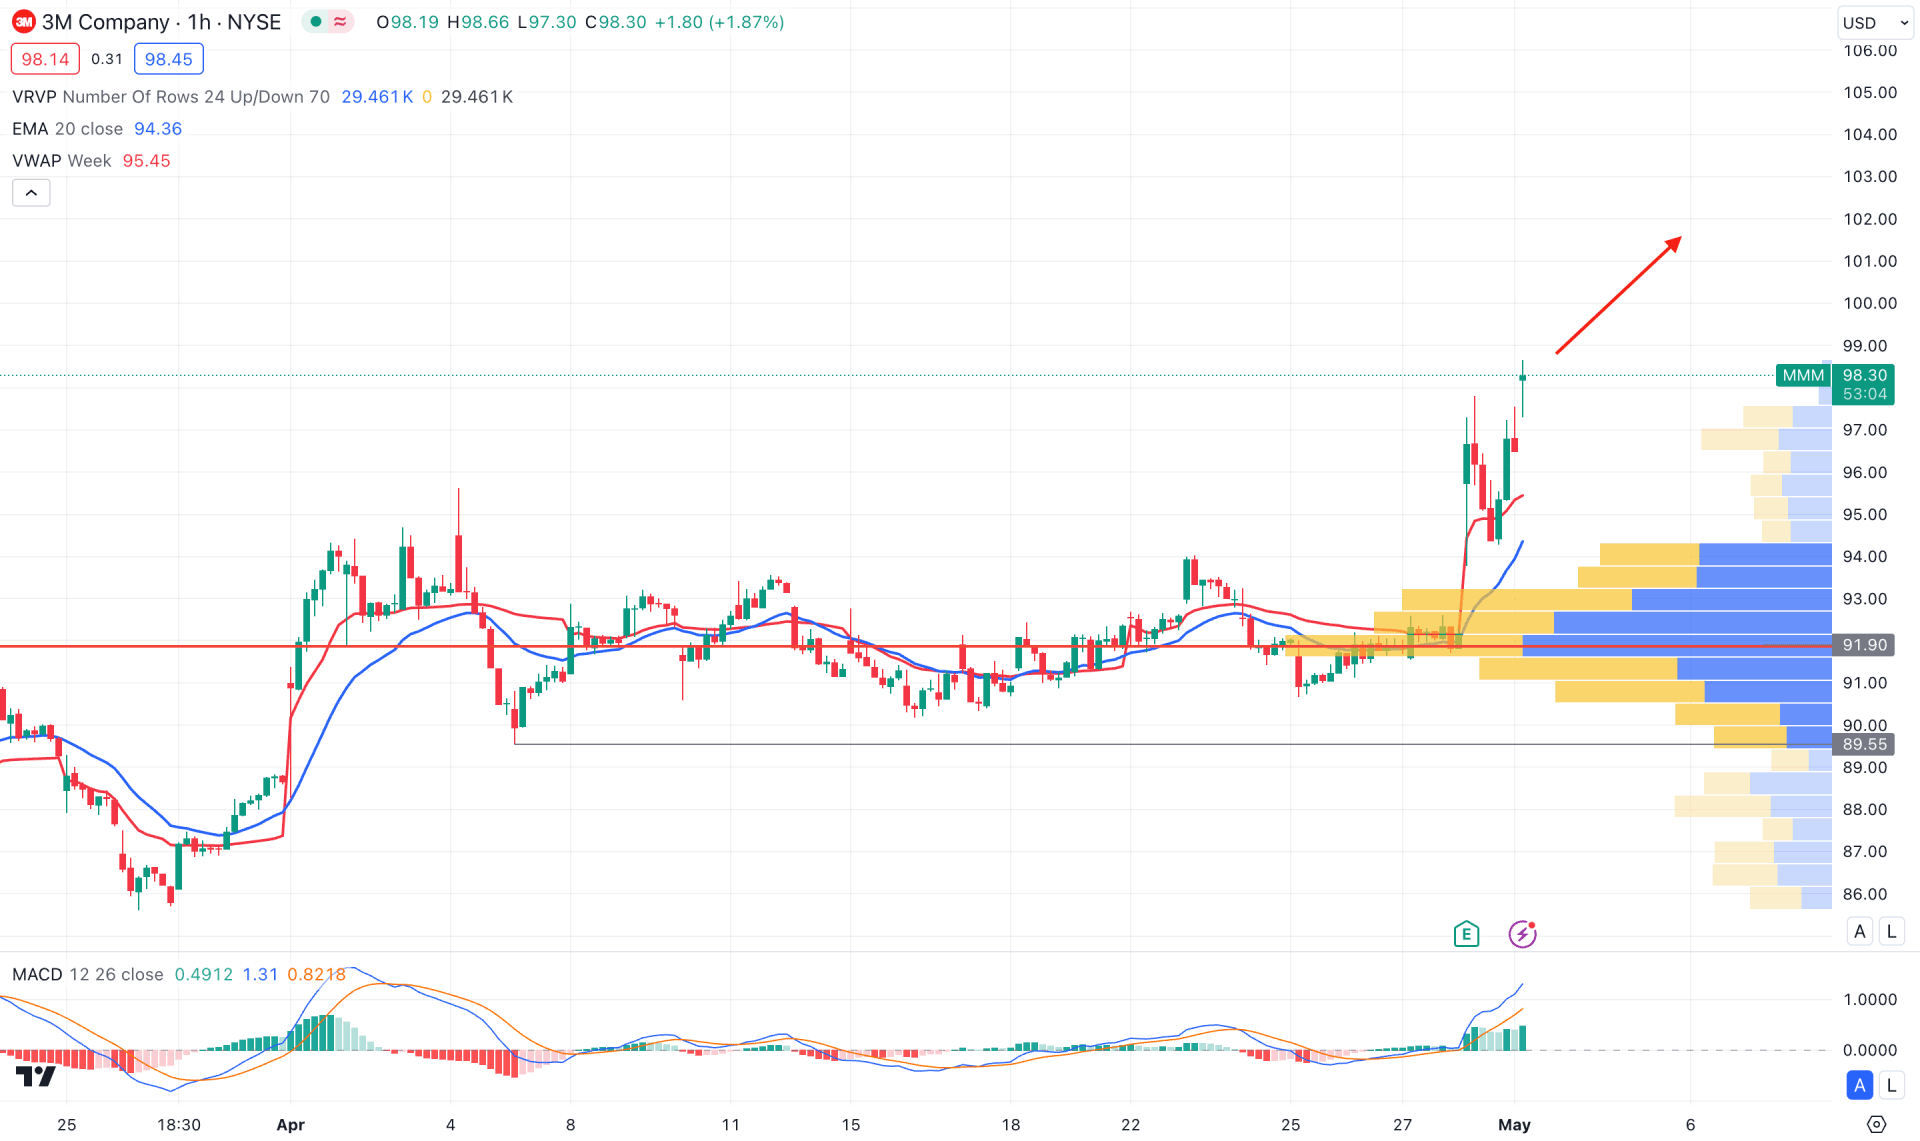
In the H1 timeframe, the ongoing buying pressure is potent for the MMM stock as the current price trades higher from the visible range high volume level. Moreover, the dynamic 20 EMA is below the current price, suggesting an intraday buying pressure.
In the indicator window, the MACD Histogram maintained the upward momentum for more than 10 hours. Moreover, the signal line hovers above the neutral zone, suggesting buying pressure.
Based on the H1 outlook, any minor downside correction could be a potential long signal, targeting the 105.00 level. However, a downside pressure below the visible range high volume line could extend the loss towards the 85.00 line.
Based on the current market outlook, MMM has a higher possibility of continuing higher. However, investors should closely monitor the intraday price as any exhaustion from the rectangle resistance could be a bearish signal.